Geometer’s Sketchpad Tutorial 2: Constructing the Dancing Triangle

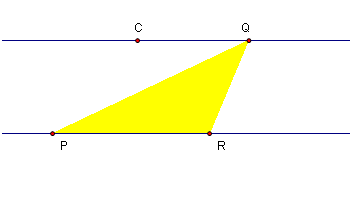
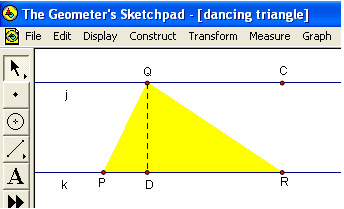
In Geometer’s Sketchpad Tutorial 1, we have learned how to construct an equilateral triangle. In this tutorial, we will explore the relationship of a triangle with a moving vertex on a line parallel to its base.  We will construct the drawing shown in Figure 1. In Figure 1, PQR is a triangle, QC is parallel to PR and QD is the altitude of triangle PQR.

What happens if we move Q along QC with points P and R fixed?

Figure 1 – Triange PQR with three of its vertices on two parallel lines.

In constructing the figure, we will learn the following skills:

  • construct perpendicular and parallel lines
  • construct interior of a triangle
  • measure the distance between two points
  • measure the area of a polygon
  • measure the length of a segment
  • rename objects

Follow the steps below to construct the Dancing Triangle.

Part I: Constructing the Dancing Triangle

1.) Open Geometer’s Sketchpad.
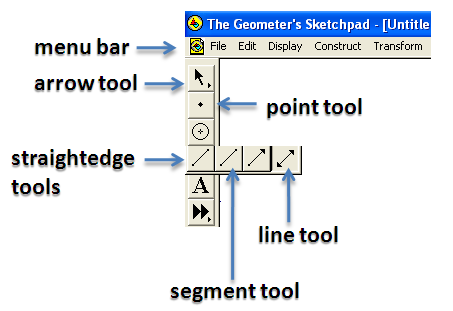
2.) Click the arrow at the straightedge tools and choose line tool.
3.) Click two distinct locations on the drawing area to construct line AB. Notice that Sketchpad names the objects in alphabetical order.

4.)Display the label of the two points by selecting both of them, clicking the Display menu from the menu bar and selecting Show labels from the list.  If you have not read tutorial 1, we select an object by clicking the arrow tool and clicking the object. The arrow tool is used in selecting and moving objects.

5.) Next, we change the name of the two points to P and R. To rename point A to Q, select point A, click the Edit menu from the menu bar and click Properties.

Note: Be sure that only point A is selected. If more than one object is selected, click the blank part of the drawing area, then click point A.

6.) In the Properties dialog box, click the Label tab and change the name of A to P as shown in Figure 3 and click the OK button when you are done.

Figure 3 – The Properties dialog box.

7.) Rename point B to R. You can display the Edit Properties dialog box by right-clicking point B and choosing Properties from the pop-up menu.

8.) Select the point tool, and construct a point on the drawing pad not on line PR.

9.) Display the name of the point. If you have followed correctly, the name of the point should be point C, otherwise you rename it C. (The names of the objects do not really matter much, but we will refer to them later using their names, so it is important that  you rename them as instructed).

Figure 4 – Point C not on line PR.

10.) We construct a line parallel to PR and passing through point C. To do this, select line PR (click the line, not the points), select point C, click the Construct menu and click Parallel line from the list. Move points P, C and R. What do you observe?

11.) We construct a point on the line parallel to PR. To do this, click the line parallel to PR passing through C, and click Point on Parallel line.

12.) Display the label of the fourth point (refer to number 4) and rename it to Q (refer to number 6 or 7).  Move point Q and point C. What do you observe? What is the difference between point Q and point C?

13.) To construct the interior of triangle, select point P, Q and R (be sure that only the three points are selected), then click the Construct menu and click Triangle Interior. Your diagram should look like the one shown in Figure 5. Move point Q. What do you observe about the interior of the triangle?

Figure 5 – Triangle PQR with with three of its vertices on two parallel lines.

Part II: Exploring the Properties of the Dancing Triangle

We have finished our construction. Now, we will observe what happens to the area of the triangle if we move point Q along the line parallel to PR.

14.) To display the area of the triangle, click the interior of the triangle, click the Measure menu, then click Area. Notice that a text containing the area of PQR appeared at the left corner of your drawing area.

15.) Move point Q. What do you observe? Can you think of the reason why your observation is such?

16.) The area of a triangle is the product of its base and its altitude. So, let us see what happens to the length of the base and the altitude when we move point Q. To display the length of the base we just have to find the distance between P and R. To do this, click points P and R, click the Measure menu and click Distance.

17.) Move point Q. What can you say about the measure of the base of the triangle?

18.) Next, we construct the altitude of triangle PQR. Since the altitude of the is perpendicular to its base, we must construct a segment perpendicular to PR and passing through Q. To do this, click line PR (not the points), select point Q, then click the Construct menu and select Perpendicular Line form the list.

19.) Next, we construct the intersection of PR and the line perpendicular to it. To do this, select line PR (not the points), click the line perpendicular to PR, then click the Construct menu and click Intersection form the list.

20.) Display the label of the intersection point. Its name should be D.

21.) We hide the line QD, but leaving points Q and D. To do this, right click line QD (not the points), then click Hide Perpendicular Lines, then select the segment tool, click point Q and click point D.

22.) To turn altitude QD to a dashed line, right click it and choose Dashed from the pop-up menu.

23.) Our last step is to display the length of QD. To do this, select segment QD (not the points), click the Measure menu, then click Length.

24.) Now move the points on the drawing. What do you observe?

25.) Move point Q along the line. What do you observe?

26.) Explain why the area of the triangle is constant when you move point Q.

In the Geometer’s Sketchpad Tutorial 3, we are going to learn how to construct graphs and sliders.
An Intuitive Introduction to Limits

Limits is one of the most fundamental concepts of calculus. The foundation of calculus was not entirely solid during the time of Leibniz and Newton, but later developments on the concept, particularly the \epsilon-\delta definition by Cauchy, Weierstrass and other mathematicians established its firm foundation. In the discussion below, I shall introduce the concept of limits intuitively as it appears in common problems. For a more rigorous discussion, you can read the post article titled “An extensive explanation about the \epsilon-\delta definition of limits”.

Circumference and Limits

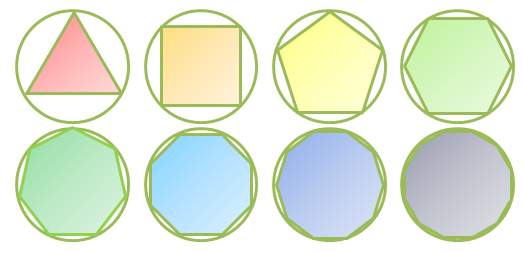
If we are going to approximate the circumference of a circle using the perimeter of an inscribed polygon, even without computation, we can observe that as the number of sides of the polygon increases, the better the approximation. In fact, we can make the perimeter of the polygon as close as we please to the circumference of the circle by choosing a sufficiently large number of sides.  Notice that no matter how large the number of sides our polygon has, its perimeter will never exceed or equal the circumference of the circle.

Introduction to Limits

Figure 1 – As the number of side of the polygons increases, its perimeter gets closer to the circumference of the circle.


In a more technical term, we say that the limit of the perimeter of the inscribed polygon as the number of its sides increases without bound (or as the number of sides of the inscribed polygon approaches infinity) is equal to the circumference of the circle.  In symbol, if we let n be the number of sides of the inscribed polygon, P_n be the perimeter of a polygon with n sides, and C be the circumference of the circle, we can say that the limit of P_n as n \to \infty is equal to C. Compactly, we can write \lim_{n \to \infty} P_n = C.

Functions and Limits

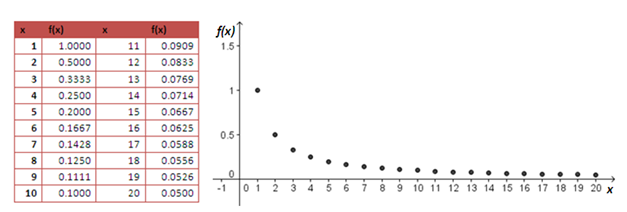
Consider the function f(x) = \frac{1}{x} where x is a natural number. Calculating the values of the function using the first 20 natural numbers and plotting the points in the xy-plane, we arrive at the table and the graph in Figure 2.

Introduction to Limits

Figure 2 – As x increases, f(x) gets closer and closer to 0.

First, we see that as the value of x increases, the value of f(x) decreases and approaches 0. Furthermore, we can make the value of f(x) as close to 0 as we please by choosing a sufficiently large x. We also notice that no matter how large the value of x is, the value of f(x) will never reach 0.

Hence, we say that the limit of f(x) = \frac{1}{x} as the value of x increases without bound is equal to 0, or equivalently the limit of f(x) = \frac{1}{x} as x approaches infinity is equal to 0. In symbol, we write the limit of f(x) \to \infty as x \to 0 or more compactly the \lim_{x \to \infty} \frac{1}{x} = 0.

Tangent line and Limits

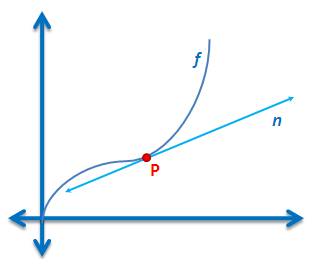
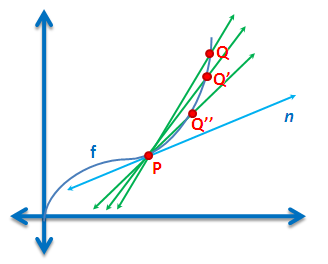
Recall that the slope of a line is its “rise” over its “run”. The formula of slope m of a line is m = \displaystyle\frac{y_2 - y_1}{x_2 - x_1}, given two points with coordinates (x_1,y_1) and (x_2,y_2).  One of the famous ancient problems in mathematics was the tangent problem, which is getting the slope of a line tangent to a function at a point.  In the Figure 3, line n is tangent to the function f at point P.

Figure 3 – Line n is tangent to the function f at point P.

If we are going to compute for the slope of the line tangent line, we have a big problem because we only have one point, and the slope formula requires two points.  To deal with this problem, we select a point Q on the graph of f, draw the secant line PQ and move Q along the graph of f towards P. Notice that as Q approaches P (shown as Q' and Q''), the secant line gets closer and closer to the tangent line. This is the same as saying that the slope the secant line is getting closer and closer to the slope of the tangent line. Similarly, we can say that as the distance between the x-coordinates of P and Q is getting closer and closer to 0, the slope of the secant line is getting closer and closer to the slope of the tangent line.

Figure 4 – As point Q approaches P, the slope of the secant line is getting closer and closer to the slope of the tangent line.

If we let h be the distance between the x-coordinates of P and Q, m_s be the slope of the secant line PQ and m_t be the slope of the tangent line, we can say that the limit of the slope of secant line as h approaches 0 is equal to the slope of the tangent line. Concisely, we can write \lim_{h \to 0}m_s = m_t.

Area and Limits

Another ancient problem is about finding the area under a curve as shown in the leftmost graph in Figure 5. During the ancient time, finding the area of a curved plane was impossible.


Introduction to Limits

Figure 5 – As the number of rectangles increases, the sum of the area of the rectangles is getting closer and closer to the area of the bounded plane under the curve.

We can approximate the area above in the first graph in Figure 5 by constructing rectangles under the curve such that one of the corners of the rectangle touches the graph as shown in the second and third graph in Figure 5. We can see that as we increase the number of rectangles, the better is our approximation of the area under the curve. We can also see that no matter how large the number of rectangles is, the sum its areas will never exceed (or equal) the area of the plane under the curve. Hence, we say that as the number of rectangles increases without bound, the sum of the areas of the rectangles is equal to the area under the curve; or the limit of the sum of the areas of the rectangles as the number of rectangles approaches infinity is equal to the area of the plane under the curve.

If we let A be the area under the curve, S_n be the sum of the areas of n rectangles, then we can say that the limit of S_n as n approaches infinity is equal to A. Concisely, we can write \lim_{n \to\infty} S_n = A.

Numbers and Limits

We end with a more familiar example usually found in books. What if we want to find the limit of 2x + 1 as x approaches 3?

To answer the question, we must find the value 2x + 1 where x is very close to 3. Those values would be numbers that are very close to 3 – some slightly greater than 3 and some slightly less than 3. Place the  values in a table we have

Figure 6 – As x approaches 3, 2x + 1 approaches 7.

From the table, we can clearly see that as the value of x approaches 3, the value of 2x + 1 approaches 7.  Concisely, we can write the \lim_{x \to 3} 2x + 1 =7.

Mr. Jayson Dyer, author of The Number Warrior has another excellent explanation on the concept of limits in his blog Five intuitive approaches to teaching the infinitely small.

******

The area under the curve problem and the tangent problem are the ancient problems which gave birth to calculus. Calculus was independently invented by Gottfried Leibniz and Isaac Newton in the 17th century.


Screencasting Tutorial: Making a Math Video Lesson using Camstudio

Introduction

In the Free Mathematics Tutorial Videos post,  I have shown you an example of a screen cast video. Another example is shown below. Click the video below to watch the screencast.

The video shown above is an example of a screencast video.  Screencasting is the process of recording activities on your screen. Recording can be accompanied by a background sound from the computer or recorded voice through a microphone.

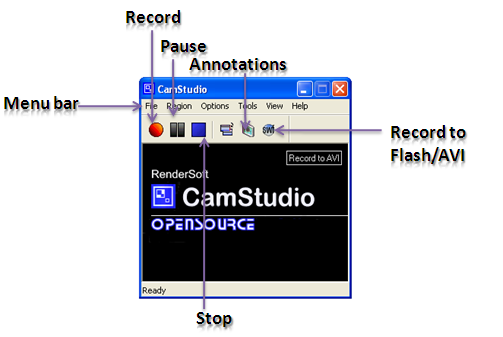
Figure 1 – The CamStudio Window

Things Needed to Screencast

1.)    Screencasting Software. There are commercial software on the net that you can purchase.  One of the most popular software is Camtasia Studio. You can also use CamStudio (see Figure 1), a free screencasting software that we will use in the tutorial below. There is also a list of screencasting software here .

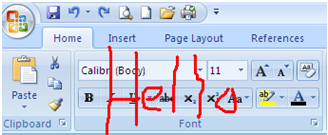
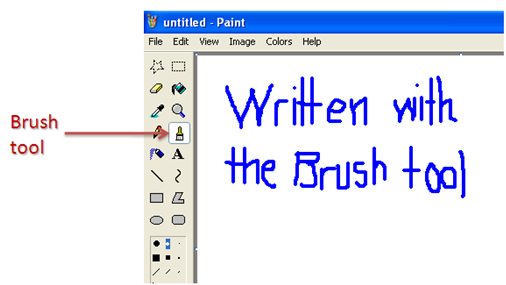
2.)    An electronic board. We can use Paintbrush and use the Brush tool (see Figure 3) as pen just like the video above.  Another interesting software that can be used as pen is ZoomIt, where you can zoom and write everywhere on your screen, even on your desktop or the icons of your word processor (see Figure 2).  But note that Zoomit writings are erased when you press the Esc key.

3.)    A microphone (if you want to record your voice) and a computer pen/writing pad (if you have to do a lot of writing).

Figure 2 – Sample text written by Zoomit on the MS Word toolbar.

Figure 3 – Sample text written using the Brush tool of Paintbrush.

Screencasting with Camstudio

In this tutorial, we are going to create a sample screencast just like what you have seen above.

1.)    Open Paintbrush, or your own chosen electronic board.

2.)    Open Camstudio and choose what kind of video you file you want to save AVI or SWF. SWF are flash files while AVI are video files. You can choose the video file type by clicking the Record to AVI/Flash button.

3.)    Click the annotations button and choose your annotations from the Screen Annotations dialog box.

4.)    Choose the region of the screen you want record. You can record the entire screen or a fixed region just like the Paintbrush window (not occupying the entire screen).

  • To choose a region to record, click the Region menu from the menu bar, then choose Region from the drop down box. Click the Record button, then drag the mouse pointer to the region that you want to record.
  • To record a fixed region, click Region from the menu bar, then choose your Fixed Region. In the Fixed Region dialog box, click the Select button then drag the mouse pointer on the region that you want to record. Click the Record button and drag the mouse to the region that you want to record. The fixed region means in CamStudio means  fixed size, not fixed location.
  • To record the entire screen, click Full Screen from the menu bar, then click Full screen. Click the Record button.

5.)    Click the Record button to record button. Now, speak on the microphone while writing your math lecture. You can press the Pause button if you want to pause recording.

6.)    Click the Stop button when finished and save your file.

If you have saved your files in AVI you may use other video editing software such as Windows Movie Maker to enhance your recorded video.

1 2 3 4 7