GeoGebra Tutorial 22 – Spreadsheets, Vectors, and Matrices
This is the 22nd tutorial of the GeoGebra Intermediate Tutorial Series. If this is your first time to use GeoGebra, you might want to read the GeoGebra Essentials Series.
In this tutorial, we explore the relationship between the product of two 2 x 2 matrices. We set the entries of the factor matrices to integers, and limit the second matrix entries to values of -1, 0, and 1. We will also observe the relationship between their graphical interpretations.
First, we enter values of the first 2 x 2 matrix in cells A1, B1, A2 and B2, then create the multiplier matrix determined by sliders a, b, c and d. We enter the formulas of product matrix cells in E1, F1, E2 and F2. The ordered pairs (A1,B1), (A2,B2) are the factor matrix and the ordered pairs (E1,F1) and (E2,F2) will be the product matrix.
You can view the output of this tutorial here.
Step-by-Step Instructions
| 1. Open GeoGebra and select Spreadsheet and Graphics from the Perpsectives menu. | |
| 2. To show labels of points only, click the Options menu, click Labeling, and then click New Points Only. | |
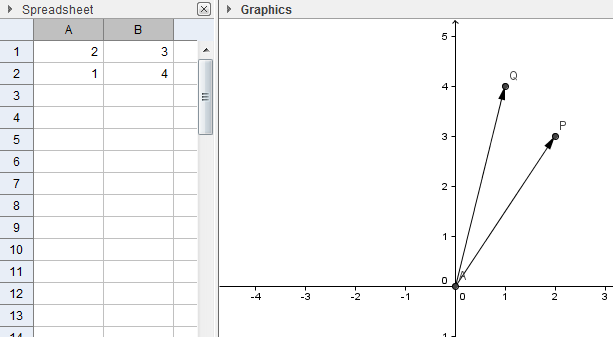
| 3. Type the following numbers in the GeoGebra Spreadsheet: 2 in cell A1, 3 in cell B1, 1 in cell A2 and 4 I cell B2 (see Figure 1). | |
|
|
4. Highlight the four numbers, and then select Create List of Points (Figure 2). Notice that two points appear in the coordinate plane. Rename the point A to P and point B to Q .
 Figure 2 |
| 5. We now construct point A on the origin. This will be the initial points of vectors that we are going to create later. To create the point A, click the Graphics view, select the Intersect Two Objects tool, click the x-axis and the y-axis. | |
| 6. To construct vector AP, select the Vector between Two Points tool, click point A and then click P. Now, construct vector AQ. Your drawing should look like the figure below.
|
|
| 7. Next, create sliders a, b, c and d, which will be the entries of our second matrix. To create slider a, select the Slider tool and click anywhere on the drawing pad to display the Slider dialog box. | |
| 8. In the Slider dialog box, be sure that the Number option button is selected. Type a in the name box, set the minimum value to -1, the maximum value 1, and the increment to 1, and click the Apply button. | |
| 9. Now, construct sliders b, c and d with the same interval and increment as that of slider a. | |
| 10. Next, we place the matrix
in C1,D1,C2 and D2. We do this by typing a in C1, b in D1, c in D2 and d in D2. |
|
|
|
11. To multiply the two matrices, type = A1*C1 + B1*C2 in E1, =A1* D1 + B1 * D2 in F1, = A2 * C1 + B2 * C2 in E2 and =A2*D1 + B2*D2 in F2. (Recall how to multiply two by two matrices). |
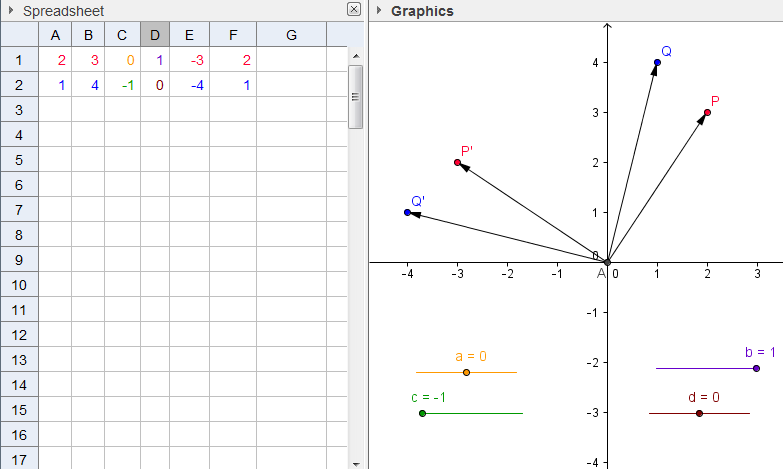
12. Now, set the sliders to a = -1, b = 0, c = -1, d = 0. The values should look like the values in the spreadsheet as shown in Figure 4.
 Figure 4 |
|
|
|
13. We now construct a list of points (or the same as plot the points) of the product of the matrices. To do this, highlight the product of our two matrices (E1:F2), right click the selection and click on Create List of Points from the context menu. This will plot the new points B and C. Rename points B to P’ and point C to Q’. |
| 14. Using the Vector Between Two Points tool, construct AP’ and AQ’. | |
| 15. We now change the color of the points. To do this, right click point P the points, click on Object Properties to open the Preferences window. | |
| 16. In the Preferences window, select the Color tab, and select the color from the color palette. Using the Objects window, change the color of P, P’ and Q and Q’. P and P’ are corresponding points so they must have the same color. Points Q and Q’ should also have the same color. | |
|
|
17. Try to adjust the values of sliders a, b, c and d and observe the matrix product and the vectors. What do you observe? |
| 18. Change the colors of the sliders along with their corresponding value in the spreadsheet. Be sure that the slider and the corresponding number have the same color. | |
| 19. Investigate the values of the product of the two matrices, and the vectors formed by them, by changing the values of the sliders. Make conjectures about them. |