GeoGebra Tutorial 26 – Constructing a Cycloid
This is the 26th tutorial of the GeoGebra Intermediate Tutorial Series. If this is your first time to use GeoGebra, you might want to read the GeoGebra Essentials Series.
A cycloid is the curve defined by the path of a point on the edge of circular wheel as the wheel rolls along a straight line. In this tutorial, we use GeoGebra to construct a cycloid, the path traced by a rotating circle. In reality, we will not really roll the circle but use mathematics to make it appear is if it is rolling. We will set the amount of rotation to but you can choose to increase it later on.
The output of this tutorial is shown above. Move the slider and observe what happens.
| 1, Open GeoGebra and select Algebra and Graphics from the Perspectives menu. Display the Axes by selecting its icon on the upper left corner of the Graphics view. | |
| 2. Next, show the the labels of the points by clicking the Options menu, click Labeling, then click New Points Only. | |
| 3. First, we will create slider with maximum value |
|
| 4. In the Slider dialog box, be sure that the Number radio button is selected, leave the name to a, set the minimum to 0, maximum to 2*pi, and then click the Apply button. | |
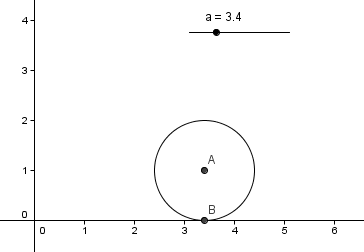
| 5. Next, we construct point A with coordinates (a,1). This will be the center of the circle. To do this, type A = (a,1) in the input box and then press the ENTER key. | |
| 6. We now construct a circle with center A and radius 1. To do this, select the Circle with Center and Radius tool, and then click point A to display the Circle with Center and Radius dialog box. | |
| 7. In the Circle with Center and Radius dialog box, type 1, then click the OK button. | |
| 8. Move the slider. What do you observe? | |
9. Next, we construct the point of intersection of the x-axis and the circle. To do this, select the Intersect Two Objects tool, click on the circle and click on the x-axis. This will display point B at the point of tangency. Your drawing should look like the figure shown in Figure 2.
 Figure 2
|
|
| 10. We now compute for the degree equivalent of radian a which we will use later to rotate point B’ with reference to point B. To convert, type r = (a*180/pi)°. The ° sign is used to distinguish angle measure from a common number. You can find the degree sign at the icon located to the immediate right of the Input bar. | |
| 11. Now, we rotate point B about point A r degrees clockwise. To do this, select the Rotate Object Around Point tool, click point B and then click point A to display the Rotate Object dialog box. | |
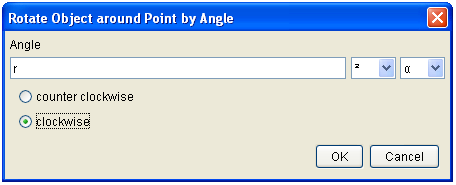
12. In the Rotate Object dialog box (Figure 3), type r in the Angle text box and select the clockwise option, then click the OK button. This will display B’, our rotating point.
 Figure 3
|
|
|
|
13. Move the slider and observe what happens. |
|
|
14. We are almost done, but first, we change the color of the rotating point to red. We will do this, so that we can easily see the rotating point. To do this, right click point B’ and select Object Properties from the context menu. |
| 15. In the Object Properties dialog box, select the Color tab and then click a red color from the palette, then click the Close button. | |
|
|
16. Next, we hide point B and hide the label of points A and B’. To hide point B, right click point B and then select Show Object. To hide the labels of points A and B’, right click each point and select Show label option from the context menu.. |
|
|
17. Next, we trace the path of point B’ (the red point). To do this, right click the red point and then click Trace On from the context menu. |
|
|
18. Move the slider from extreme left to extreme right. The path traced by the rotating point is our cycloid. |