GeoGebra Essentials 8 – Graphs and their Properties
This is the eighth tutorial in the GeoGebra Essentials Series. If you are not familiar with GeoGebra, you may want to read the Introduction to GeoGebra post and earlier tutorials.
In the tutorial below, menu commands, located in the menu bar, are in brown bold text, and submenus are denoted by the > symbol. For example, Options>Labeling>New Points Only means, click the Options menu, choose Labeling from the list, then select New Points Only. The tool texts are colored orange. For example, New Point means the new point tool. Text that are to be typed in the input box are colored blue.
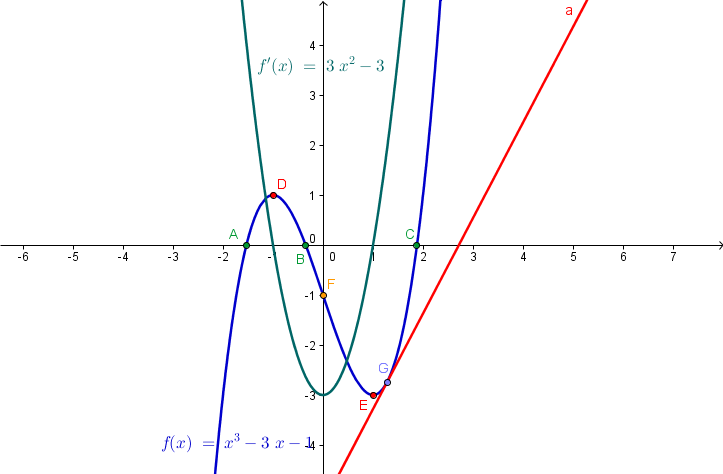
In this tutorial, we learn how to graph functions using GeoGebra. First, we graph a function, then determine its critical points (minimum, maximum, inflection point, roots) using GeoGebra keyboard commands. Then we get the derivative of the function. We also construct a point on the function and a line tangent through that point. We explore the characteristics of the tangent line in relation to the graph of the function and its derivative. The final output of our tutorial is shown above.
GeoGebra Essentials 8 – Graphs and Their Properties
In doing the tutorial, we learn the following:
- Graph polynomial, trigonometric, exponential and logarithmic functions
- Use GeoGebra commands (root, extremum, inflectionPoint) to determine the critical points of a graph.
- Use the derivative command to draw the derivative graph of a function
- Use the Tangents tool to construct a tangent line passing through a point on the graph
Instructions
| 1. Open GeoGebra. Select Algebra & Graphics in the Perspective panel located at the Sidebar. | |
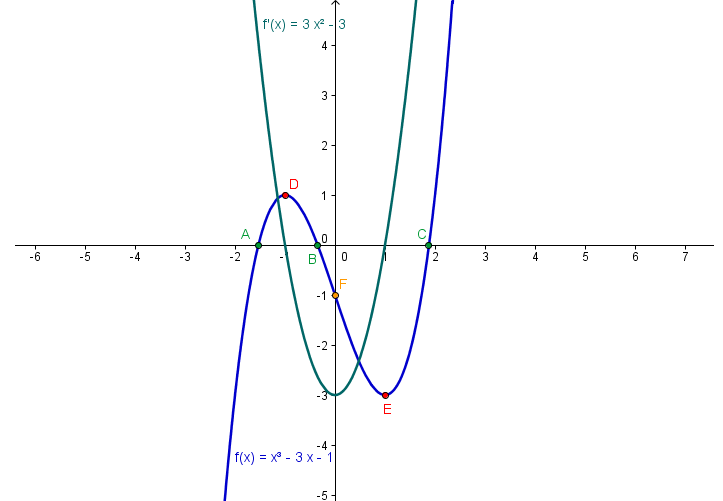
| 2. We now graph the function f(x) = x3 – 3x – 1. To do this, type f(x) = x^3 – 3x – 1 in the input bar and press the ENTER key. The ^ symbol is used for exponentiation. | |
| 3. To get the roots of the function, type root[f] and then press the enter key. How many roots are there? | |
| 4. Next to get the minimum and maximum of the graph, type extremum[f] and then press the ENTER key. How many extrema are there? | |
| 5. To get the inflection point of the graph, type inflectionPoint[f] and then press the ENTER key. | |
| 6. Now, we get the derivative of the function f. To do this, type derivative[f] in the input bar and press the ENTER key. Notice that the derivative of f is automatically named as f’. What can you say about the graph of f and its derivative?
|
|
| 7. Now, we construct a line tangent to a point on the graph. To construct the point, select the New Point tool and click the graph of the function f. | |
| 8. Be sure that the name of the point is G. If not, you can rename the point by right clicking it, clicking Rename, and then changing the name of the point on the Rename dialog box, and then clicking the OK button. | |
| 9. To construct a line tangent to f and passing though G, click the Tangents tool, click point G and click the graph of f. | |
| 10. Drag point G and observe the relationships among the graph of f, f’, the critical points, the tangent line, and then answer the questions on the applet. Note your observations and make conjectures about them. |
More on Graphing
- You can use y or the notation of the from p(x) in graphing functions. Therefore you can graph f(x) = 2x, s(x) = x^2 + 1, and y = 1 – x^3.
- You can graph the sine, cosine, and tangent functions as follows: f(x) = sin(x), g(x) = cos(x) and h(x) = tan(x). The secant, cosecant, and cotangent functions cannot be graphed directly as of this writing, so you have to use q(x) = 1/cos(x), r(x) = 1/sin(x), and r(x) =1/tan(x) for the secant, cosecant, and cotangent functions, respectively.
- You can graph the function y = |x| by typing y = abs(x).
- The exponential function and logarithmic function can be graphed by typing f(x) = e^x and g(x) = ln(x).
Last Update: 23 December 2015 (GeoGebra 5.0)

