Experimental and Theoretical Probability Part I
This the first part of the series of posts on Experimental and Theoretical Probability.
***
If two standard cubical dice are rolled, one red and one blue, the possible sums ranges from 2 = (1+1) and 12 = (6+6).

Now, are the chances of getting these 11 sums equal? For example, is the chance of getting a sum of 2 similar to the chance of getting a sum of 5?
Let us try to roll the two dice 1000 times. Of course, we will not do this manually. We will use a spreadsheet (I used MS Excel, but you can do this in Open Office Calc) to simulate the roll. We will choose random numbers from 1 through 6 in column A of Excel, and then we will also do this in column B. Then, we add them and place the sum in column C.

Figure 1
If you are interested to do it, here are the steps:
- Open MS Excel, type Die1 in cell A1, Die 2 in cell B1 , and Sum in C1 (see Figure 1 left).
- Type =randbetween (1,6) in cell A2, and then press the ENTER key. This chooses randomly from 1 through 6 and displays it in cell A2.
- Copy cell A2 to cell A1001. You can do this by selecting cell A2, and then dragging bottom right corner all the way down to A1001.
- Do step 2-3 in cell B2 to B1001.
- Next, we add the number of dots in cell A2 and B2. Type = A2 + B2 in cell C2, and then press the ENTER key. Now, copy C2 all the way to C1001 by dragging the bottom right corner all the way down to C1001.
- Next, we will create the Sum-Frequency table (see Figure 1 right). Type Sum in cell G2 and type Frequency in cell H2.
- Then type 2 in cell G3, 3 in cell G4, 4 in cell G5, …, 12 in cell G13.
- Now type =countif(C1:C1001,2) in H3. This counts the number of occurrences of the number 2 in the Sum column (C1 through C1001). Next type =countif(C1:C1001,3) in H4. Do this all the way down to 12.
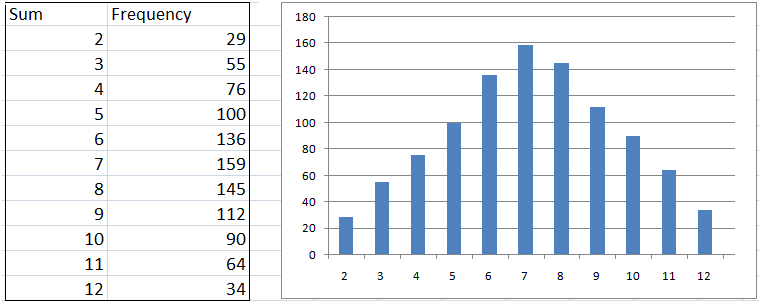
The result of this simulation is shown in Figure 2. The table is shown at the left and (I have added) the graph shown at the right. If you do this in Microsoft Excel, of course, your result would be slightly different since the numbers are randomly chosen. But try to see if we have the same observations.

Figure 2
In rolling the two dice 1000 times we only rolled a two (that is we got a sum of 2) 29 times (see Figure 2), while we rolled a seven 159 times. From the frequency distribution, it seems that the chances of getting sums are not equal. It seems that if we play a 2-die rolling game, 6,7 and 8 are good bets, while 2 and 12 are not. Now, the question is, is this really true, or is it just coincidence?
We will answer this in the second part of this series.
***
Photo Credit: Transparency Demonstration (Dice) by El Sanders