Curve Sketching 2: Graphing Quadratic Functions

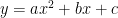
In the first part of this series, we have learned  4 easy ways to graph linear functions. . In this post, we will learn how to sketch the graph of a quadratic function. Quadratic Functions are functions with equation y = ax^2 + bx +c where a \neq 0. This is the standard form. This equation can also be expressed in the form y = a(x-h)^2 + k where a \neq 0 is the vertex form.

Unlike linear functions, we need more than two points to sketch the graph of quadratic functions. In the following discussion, we will examine the different properties of quadratic functions and use them to sketch their graph.

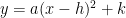
Here are some of the properties of y = ax^2 + bx + c in relation to its graph. For students, it is really important that you think about them — don’t just memorize.

» Read more

New Partner Blog: Math Concepts Explained

Math Concepts Explained  is a blog managed by Shaun Klassen that aims to help students in understanding mathematical concepts in middle school and high school mathematics. It is a math tutoring blog that covers a wide variety of topics explained using “simple language and lots examples.” Aside from the tutorials, the blog also contains links to useful resources on the web which are helpful not only to students but also to teachers.

mathconceptsexplained

If the content provided in the posts isn’t quite clear for any reason, students are encouraged to leave comments if they require additional clarification of the material, or to request certain topics to be covered in future posts. On his profile page, Shaun says:

I would like to pass on some of what I learned to you, students who are looking for help with math. I recognized when I was in school how valuable it was to have a reliable resource to help me with my math studies, and that is what I am trying to recreate on this blog.

You may like Math Concepts Explained Facebook Page and follow on Twitter at @MathConcepts.

Graph Sketching I: 4 Easy Ways to Graph a Linear Function

This is the first part of the Graph Sketching Series. Sketching is the process of drawing a rough idea of the overall shape of the graph. A graph sketch is a rough estimate of the actual graph of a function.

In this series, we will start with the graph of linear functions, then we will proceed with  polynomial and rational functions later. We will also discuss how to sketch the graphs of trigonometric functions later.

In this post, we use different strategies to graph y = 2x – 1, a linear function. Since the graph of a linear function is a straight line, we only need two points to graph it. Here are four different ways to sketch the graph of linear functions. » Read more

1 2 3 4 5 7