Exploring Wolfram Alpha for iOS

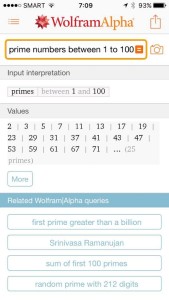
I am a fan of free apps and I have promoted a lot of them in this blog, but there are times that I also purchase premium apps. For the past few days, I have been exploring Wolfram Alpha for iOS which can be purchased in iTunes for $2.99. For those who have not heard about it yet, it is a knowledge engine developed by Wolfram Research. In layman’s words, it is an engine that answers factual queries and returns curated data rather than a list of files or web pages which is what search engines do. For example, if you search “primes between 1 and 100,”  it returns the list of primes as shown below. To know more about Wolfram Alpha, you  can read my introductory post about it here.

Exploring Wolfram Alpha

Wolfram Alpha covers a wide variety of topics. This includes mathematics, linguistics, dates and times, chemistry, money and finance, physics, health and medicine, engineering, geography, transportation, weather and meteorology, and many more.

Another unique feature of the iOS app is it is directly connected to Siri.  You can just ask Siri about your queries and Siri will return answers from Wolfram Alpha. For devices without Siri, you can also type your queries. In iOS devices, a special keyboard with mathematical symbols appear every time you access Wolfram Alpha.

You can also download the FREE Wolfram Alpha Viewer to explore Wolfram Alpha results from Siri and learn how to use the commands effectively. You can also access Wolfram Alpha online.

GeoGebra Graphing Calculator for Android now available

For GeoGebra fans who are Android users, the long wait is over. GeoGebra has just released the new GeoGebra Graphing Calculator for Android phones and tablets. According to GeoGebra’s official blog, this new version has Algebra and Graphics views, but more features will be added soon. They are also planning to release iPhone and Windows versions later.

I have downloaded this app and the first feature I looked for was a slider, and so far, it’s working just like the the PC version. Just like in the PC versions, you can also use the materials uploaded in GeoGebraTube» Read more

Properties and Graph of Linear Functions

In the previous three posts, we have learned about graph of linear functions in relations to its graph. We summarize these learnings in this posts.

The linear function has equation y = ax + b where a and b are real numbers. The number a is the slope of the graph of the function and the number b is the y-intercept. The sign of a determines the direction of the graph (click here for detailed explanation). If a > 0, the function is increasing and if a < 0 then the function is decreasing. If a = 0, the graph of the function is a horizontal line.

The value of a determines the steepness of the graph (click here for detailed explanation). As the absolute value of a increases, the graph becomes steeper. The value of b increases the value of the function by b if b > 0 and decreases the value of the function if b < 0 (click here for a detailed explanation). Graphically, this translates the function vertically — up of b > 0, down if b < 0.

For more mathematics posts, visit our Mathematics page. For the latest posts, visit Post List. For the complete list of more than 1000 articles about Mathematics and Multimedia, visit our Archives page.

1 2