Understanding Domain and Range Part 1
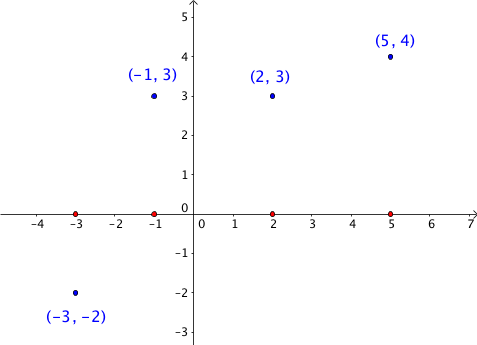
The domain of a function is the set of x-coordinates of the points in the function. The range of the function f is the set of y-coordinates of the points in the function. So if we have a function f with points (-3, -2), (-1, 3), (2, 3), and (5,4), then the domain of the function f is the set {-3, -1, 2, 5} and the range of f is the set {-2, 3, 4). Graphically, we can say that the domain is the “projection” of the points to the x-axis (see red points in the following figure).
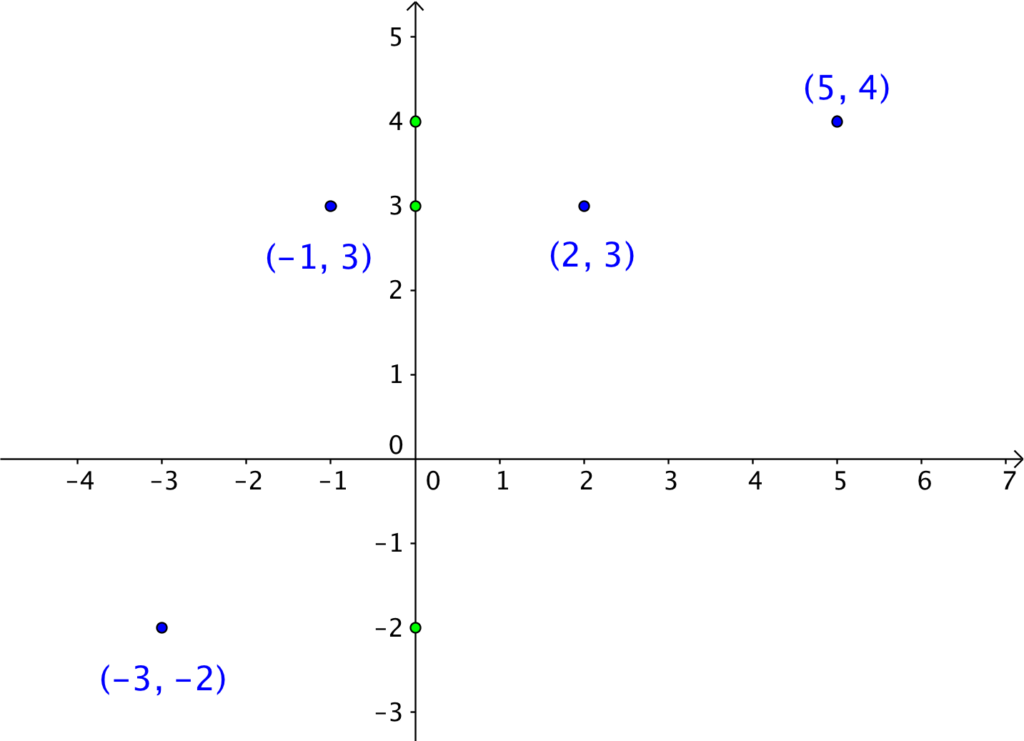
The range of f is the projection of the points to the y-axis (see green points in the following figure).
Example 1
In the function g, we can see that the projection of the graph to the x-axis is the set of real numbers from -1 to 2 (see red line segment), however, small “empty circle” indicates that the domain does not include 2. Therefore, the domain of g is the set of real number
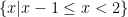
In interval notation, that is 
Recall: The interval notation where a is less than b, ![[a, b]](http://s0.wp.com/latex.php?latex=%5Ba%2C+b%5D&bg=ffffff&fg=000&s=0&c=20201002)

![(a, b]](http://s0.wp.com/latex.php?latex=%28a%2C+b%5D&bg=ffffff&fg=000&s=0&c=20201002)

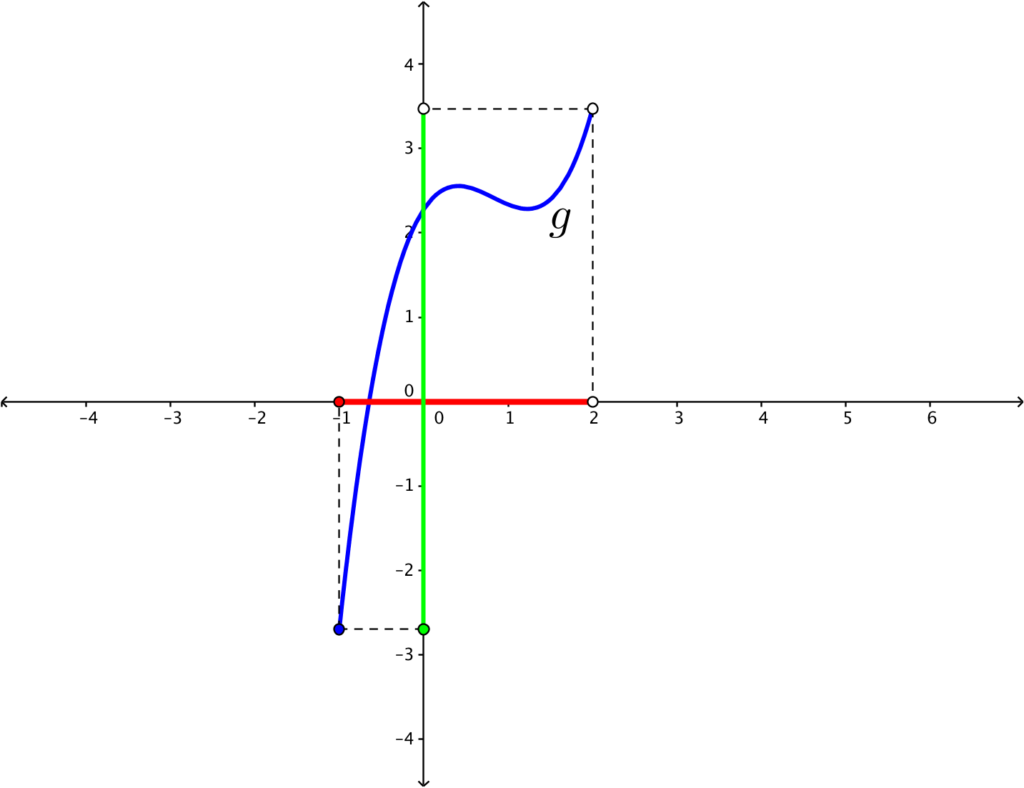
Looking at the graph, the projection of the graph to the y-axis is from -2.7 up to 3.5 but not including 3.5 because of the empty circle (see green line segment). Therefore, the range is the set

or 
Example 2
In the function h, the projection of the graph to the x-axis is from -3 to 2, except -2. Therefore, the domain of h is the set of real numbers from -3 to 2, excluding -2. Using the interval notation, we can them into two intervals which are from -3 to 2 and from -2 to 2 excluding -2 on both intervals.
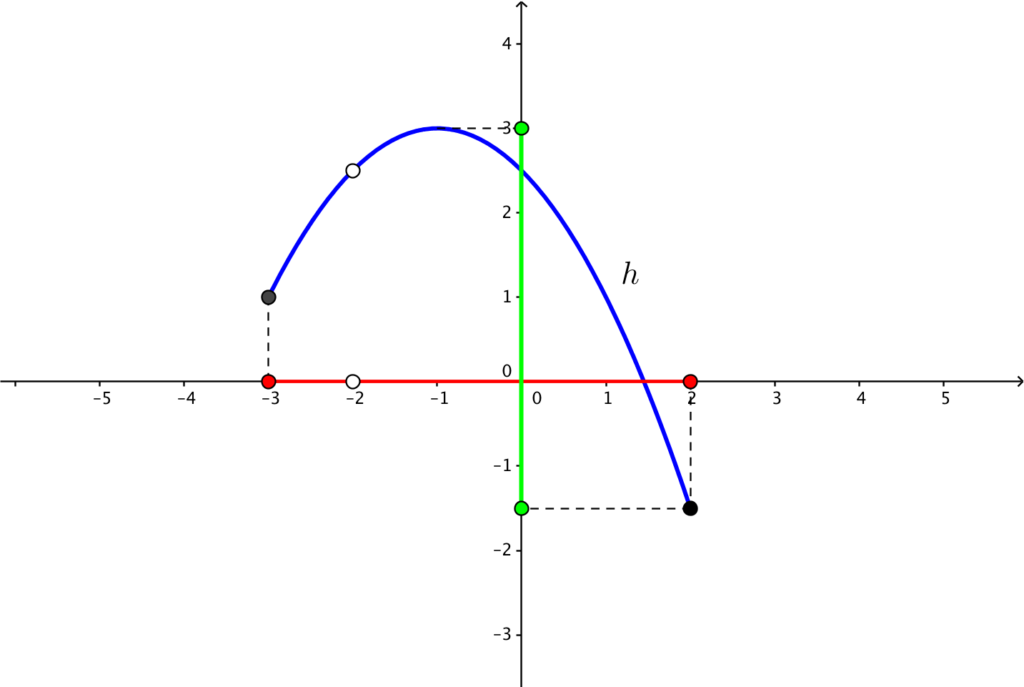
In interval notation, we can say that the domain of h is ![[-3, -2) \cup (-2, 2]](http://s0.wp.com/latex.php?latex=%5B-3%2C+-2%29+%5Ccup+%28-2%2C+2%5D&bg=ffffff&fg=000&s=0&c=20201002)
Example 3
The projection of the graph 

Example 4
The graph of the linear function 
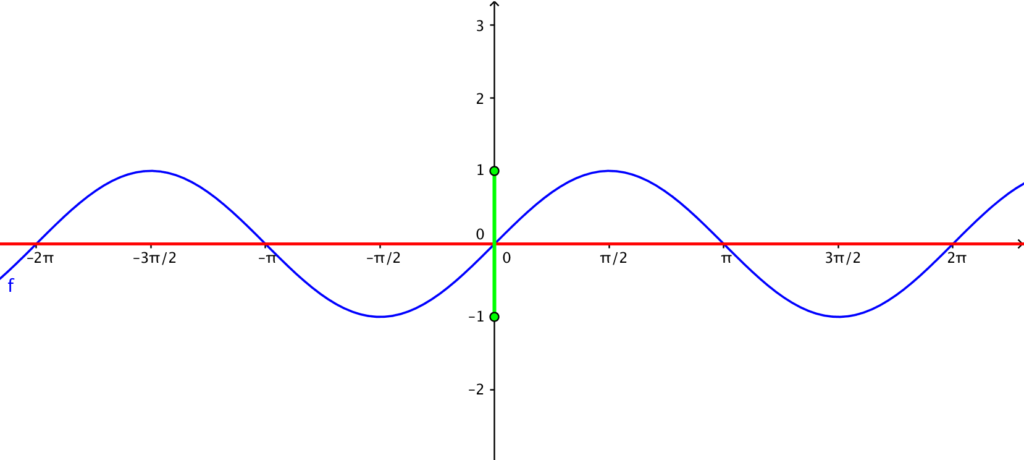
Example 5
The domain of the sine function 
Now, you have a conceptual understanding of the graphical representation of domain and range. In the next post, we are going to learn some algebraic methods on how to find the domain and range of functions.