A Calculus Primer Part 3

This is the third part and the conclusion to the Mathematics and Multimedia’s Calculus Primer Series. The first part can be read here and the second part can be read here.

In the previous part of this series, we have discussed how mathematicians of the ancient times found clever ways to find the area of regions bounded by curves. We used this knowledge to generalize a way to solve the distance traveled by an accelerating car. In this post, we continue with the discussion of the second problem: How do we find the acceleration of the car at a particular instance?

Acceleration Graph - Calculus Primer

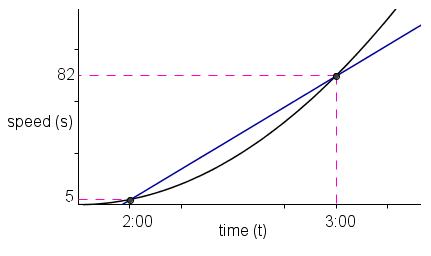
Recall that in the problem, at 2 o’clock, the speed of the car is 5 kilometers per hour and at 3 o’clock, its speed is 120 kilometers per hour. So, the acceleration is 77 km/hr/hr. » Read more
A Calculus Primer Part 2

Introduction

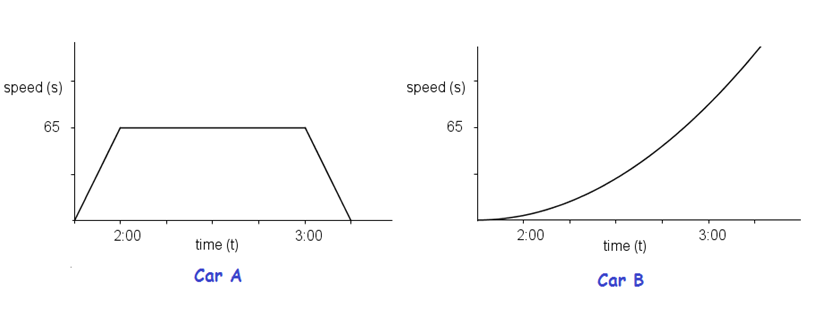
In the first post in this series, we discussed about the graph of the speed over time of two cars, A and B.  Car A was traveling at a constant speed from 2 to 3 o’clock, while Car B was traveling the same time but accelerating.

calculus primer

In the discussion, we learned that the distance traveled by the cars is represented by the area under their graphs, while acceleration is represented by slope of the line passing through two points on the graph. We ended our discussion with two questions: » Read more

Motion and Graphs: A Calculus Primer

As I have stated in the introduction to Solving Motion Problems, a moving object discussed in elementary and middle schools are usually assumed to be at a constant speed. For example, a car traveling at 65 kilometers per hour is assumed to travel at the said speed the whole time. Of course, this is not what happens in reality. The car speeds up, slows down, or stops at times.

motion graphs

Click image to enlarge

The graphs of two cars traveling at different speeds (kilometers per hour) are shown above. Car A is traveling at a  constant speed from 2:00 to 3:00 as shown in the first graph. Since the speed is constant, the graph is a horizontal line. The graph of the accelerating Car B is shown on the right. The car is accelerating, so the graph curves upward as it goes to the right. » Read more

1 2 3 4 5 6 7