This is the 16th GeoGebra Tutorial in the GeoGebra Tutorial Series. If this is your first time to use GeoGebra, I suggest that you read the GeoGebra Essentials Series first.
In this tutorial, we use the Slider tool and the sequence command to divide a segment into n equal partitions. If you want to view the final output of the tutorial click here.
Step-by-step Instructions
|
1. Open GeoGebra and select the Algebra & Graphics view from the Perspectives menu. |
|
2. To label points only, click the Options menu, click Labeling, and then click New Points Only. |
 |
3. To create point A on the origin, select the Intersect Two Objects tool, click on the x-axis then click on the y-axis. |
 |
4. To create point B on the x-axis, select the New Point tool and then click anywhere on the positive x-axis. Drag point B to be sure that it moves only along the x-axis. If not, delete the point and repeat this step. |
 |
5. Next, we construct ray AB. To do this, click the Ray through Two Points, click point A, and then click point B. |
|
6. Next, hide by clicking on its icon on the upper left of the Graphics view.
 Figure 1 |
|
7. Next, we hide by right clicking on point B, and then clicking on Show Object in the context menu. |
|

|
8. Now, we create a point C on the ray. The idea of steps 3-7 is to ensure point C will only move along the ray and only on the positive x-axis. This is because we are going to use the point at the origin as the leftmost point of the segment AC. |
|
9. Now, we hide the ray. To do this, right click the ray (not the points) and uncheck Show Object by clicking it. That only leaves points A and C in the Graphics view. |
 |
10. Select the Segment through Two Points tool, click point A and click point C to construct segment AC. Your drawing after this step should look like the figure below.
 Figure 2 |
 |
11. Our task is to divide segment into AC into n parts. So, we will create a slider with value from 1 to 20, and an increase of 1. To do this, select the Slider tool and click anywhere on the Graphics view to display the Slider dialog box (see Figure 3). |
|
12. In the Slider dialog box choose Number, change the name to n, the minimum value to 1, maximum value to 20 and increment to 1 (see Figure 3), then click the Apply button.

|
|
13. Next, we compute for the partition length of the segment if it is divided by n partitions. To do this, we divide the length of the segment by n. If you have followed the tutorial correctly, the length of the segment should be represented by b in the Algebra view. But to be sure, let us use the distance command to get the distance between A and C. We use d to denote the distance between A and C. To do this, type d = distance[A,C]. |
 |
14. Move point C and observe what happens to the value of d in the Algebra view. |
|
15. We now compute for the partition length p. Type p = d/n, then press the ENTER key on your keyboard. |
|
16. Next, we use the sequence command to produce points that will serve as division markers. To do this, type the following command and then press the ENTER key.
Sequence [(p*i, 0), i, 1, n]
The ordered pair (p*i,0) is the coordinate of the points that divide the segment. Note that i is a series of numbers running from 1 through n. For more information about the sequence command, see the explanation below. |
|
17. Now, move the slider to 20. Your drawing should look like the figure below.
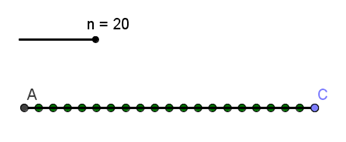 Figure 4 |
 |
18. Move point C back and forth, vary the value of n, and observe what happens. |
|
19. You can change the value of n in the Slider dialog box. To display the slider dialog box, right click the slider and click Object Properties. |
Explanation of the Sequence Command
The sequence command is just like the summation symbol. Their only difference is that the sequence command is that it only generates its terms and does not add them.
The general forms of the sequence command are
Sequence[<expression>,< variable>, <start value>,<end value>]
Sequence[<expression>,< variable>, <start value>,<end value>, <increment>]
For example, if we want to plot points with coordinates (1,1), (2,2), (3,3), (4,4), and (5,5), then the sequence command would be sequence [(i,i), i,1, 5]. The letter i is our dummy variable, 1 is the start value and 5 is the end value. By default, the increment of the sequence command is 1 unless stated otherwise (see general form).
In the command in step 16, we want construct points with coordinates (p*i, 0) to the right of A with coordinates (0,0).
Sequence[(p*i, 0), i, 1, n]
To give you a more concrete explanation, suppose the length of segment AC is 5 units and we want to divide it to 20 partitions. Hence, d = 5 (recall that d is the distance between A and C, see step 13) and n = 20. In step 15, we computed for the partition length p = d/n = 20/5 = 0.4. From the given n=20, the coordinates of our points is shown below.
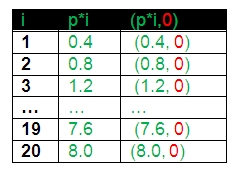
Figure 5
The rightmost column in the table shows the coordinates of the 20 points generated by the sequence.
