This is the 13th GeoGebra Tutorial in the GeoGebra Tutorial Series and in this post, we learn how to use Latex in GeoGebra. If this is your first time to use GeoGebra, you might want to read the GeoGebra Essentials Series first.
In my previous posts, we have discussed how to use Latex in writing mathematical equations in blogs and websites, and we also have learned the most commonly used Latex commands.
For those who are new to Latex, it is a typesetting program capable of generating mathematical expressions which can be embedded in blogs, forums and websites. For example, the quadratic formula below is written using Latex code
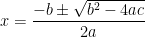 .
.
Fortunately, many mathematics software nowadays are compatible with Latex typesetting. In this tutorial, we learn how to use Latex in GeoGebra. If you already know how to code Latex, then this will be very easy for you. However, if this is your first time to use Latex, you may want to read an introduction about it.
In GeoGebra, we can only code Latex using the Insert Text tool. For example, we write the of the famous Pythagorean theorem equation c2 = a2 + b2, we need to use Latex code because GeoGebra is not capable of creating superscripts, except for equations or expressions placed in the Input bar. If we will not use Latex, our equation will appear like c2 = a2 + b2 or we can use c^2 = a^2 + b^2. But suppose the equation that we type is more complicated – such as the quadratic formula – it is impossible for us to write it without confusing the reader.
Follow the instructions below on how to use the Insert Text tool to generate Latex code. If you want to follow the tutorial step-by-step while reading, you can open the GeoGebra window here.
Instructions
1.) To use the text tool, select the Insert Text tool and click the part of the Graphics view where you want to place the text. This will display the Text dialog box.
2.) In the Text dialog box, type the code c^2 = a^2 + b^2 in the Edit box and then be sure that the Latex formula check box is checked. The ^ is the code used for exponentiation. The Preview window shows how your text will be displayed.

3.) Press the OK button when finished. Your text should look like the one shown in Figure 3.
To combine text and mathematical expressions coded in Latex, we have to separate the text and the mathematical formula. To do this, we have to enclose the mathematical expression with dollar signs. For example, if we want to write
The hypotenuse of a right triangle with sides a and b is equal to 
we have to type
The hypotenuse of a right triangle with sides $a$ and $b$ is equal to $\sqrt{a^2 + b^2}$
The GeoGebra output of the code written above is shown below.

Shown below are some of the most common symbols that are used in GeoGebra.
| LaTeX input |
Result |
| a \cdot b |
 |
| \frac{a}{b} |
 |
| \sqrt{x} |
 |
| \sqrt[n]{x} |
![\sqrt[n]{x}](http://s0.wp.com/latex.php?latex=%5Csqrt%5Bn%5D%7Bx%7D&bg=ffffff&fg=000&s=0&c=20201002) |
| \vec{v} |
 |
| \overline{AB} |
 |
| x^{2} |
 |
| a_{1} |
 |
| \sin\alpha + \cos\beta |
 |
| \int_{a}^{b} x dx |
 |
| \sum_{i=1}^{n} i^2 |
 |
If you want to practice other latex command download the list of latex symbols or comprehensive list of latex symbols.
