GeoGebra Tutorial: Graphing Functions Using GeoGebra

Basic Graphing

You can graph in by typing equations of functions in the Input box.

Figure 1 - The GeoGebra Window

Type the following equations of functions in the Input box and press the ENTER key after each equation.

  1. y = 2x + 3
  2. f(x) = -3x + 5
  3. 2x – 3y + 6 = 0
  4. g(x) = sin(x)
  5. y = x^3 – 1

Notes:

  • You can type linear equations in the following forms:  y = ax + b, f(x) = a(x) + b or ax + by + c = 0.
  • The * is used in multiplication and ^ is used in exponentiation. For example you want to graph, y = 2(x – 3)2, then you should enter y = 2*(x-3)^2.

Properties of Graph

You can change the  labels, colors, thickness and other properties of graphs (and other objects) in GeoGebra. In this tutorial we are going to change the color, label and thickness of the graph g(x) = sin(x).

To change the properties of the graph g(x) = sin(x), do the following:

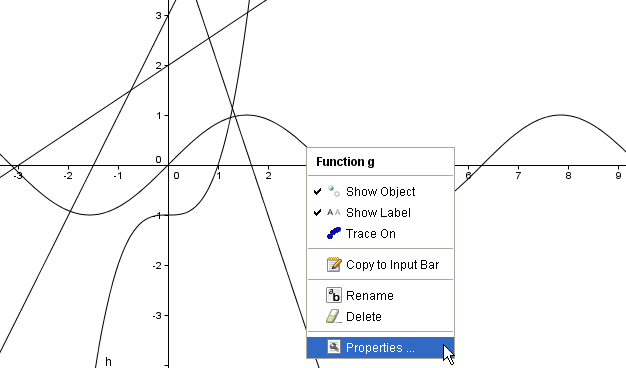
1.)    Right click the graph of the sine function then click Object Properties from the context menu.

Figure 2 - The context menu that appears when you right-click a graph

2.)    In the Basic tab, be sure that the Show label check box is checked.

3.) Choose Name and Value from the Show label drop-down list box.

Figure 3 - The Basic tab of the Properties dialog box

4.)    To change the color, click the Color tab, then choose your color from the Color palette.

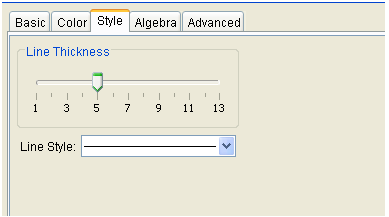
5.)    To change the thickness of the graph, click the Style tab, move the slider bar to 5.

Figure 4 - The Style tab of the Properties dialog box.

6.)    Click the Close button

Exercise: Change the properties of the other graphs. Explore the options in the Properties dialog box and see their effects to the graphs.

You may also want to view another tutorial on graphs and sliders.

GeoGebra Tutorial: Graphs and Sliders Part 2

In my post Tutorial 4: Graphs and Sliders, we learned how to use the slider in investigating graphs of the form y = mx + b. In this tutorial, we are going to use sliders to investigate the graph of the fromy = a(x – h)2+ k, where a, h and k can be any real number.  We will first input the values of a, h and k in the input box before creating the sliders.

To do this, first we are going to assign temporary values for a, h and k in the input box, then create a slider for each of them. After creating a slider, we enter the equation y = a(x – h)2+ k in the input box to graph our function.  You may want to look at our expected output here.

Instructions

    1. Open GeoGebra.
    2. Enter the following equations in the input box: a = 1, h = 1 and h = 1 in the Input box and press the ENTER key on your keyboard after typing each equation.  Observe that the equations appear in the Free Objects section of the Algebra window.

Figure 1 – Equations are entered in GeoGebra using the Input box.

    1. Right click each equation and click Show Object. Notice that the sliders appear in your drawing box.

Figure 2 – Sliders are made by right-clicking each equation and pressing the Show Object option in the context menu.

    1. Type the equation y = a*(x – h)^2 + k, the press the ENTER key. If you have typed the equation correctly, a graph should appear in your drawing pad.

Q1: Click the Move button and move the small circle on your slider. What do you observe?
Q2: What are the effects of the parameters a, h and k to the graph of the function y = a*(x – h)^2 + k?

GeoGebra Tutorial 6 – Parameterization of Length and Area

This is the sixth tutorial of the GeoGebra Intermediate Tutorial Series. If this is your first time to use GeoGebra, please read the GeoGebra Essentials Series.

In this tutorial, we are going to learn the following:

  1. use variables in GeoGebra
  2. compute using these variables
  3. use variables as parameters of objects

Problem: Given a rectangle with perimeter 10 units, find the dimension of the rectangle that can be formed that has the largest area.

This problem can be easily solved algebraically, but we are going to use GeoGebra to parameterize the length and the area of the rectangle to find its maximum area. The output of this tutorial is shown above.

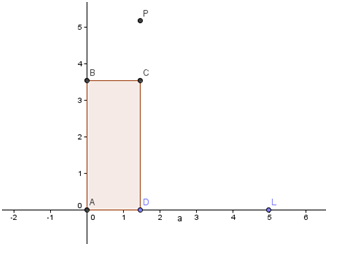
Figure 1 – Rectangle ABCD with two of its sides on the x and y-axis

Before doing the tutorial, let us first solve the problem. We know that the rectangle’s perimeter is constant, so we choose the width w.  It follows that the height h will depend on the width. For instance,  if  w=4 units, then h = (10 – 2*4)/2 which is equal to 1. Hence, h = (10 – 2w)/2. Using this information, we plan the GeoGebra construction.

  1. First we make our maximum width 5 (Why?). We will create segment AL with length 5 with A at the origin and L at (5,0)
  2. Next, we create point D on AL. With D = (w,0), AD will be the width of the rectangle.
  3. We compute for h = (10 – 2w)/2, then, and take the value as the height of the rectangle. Then, we create point B  with coordinates (0,h).
  4. We create the fourth vertex of the rectangle by getting the intersection of the horizontal line passing through B and a vertical line passing through D.
  5. Lastly, create ABCD using the polygon tool, and then produce point P (w, A_r) where A_r is the area of the rectangle.

Instructions

1.) Open GeoGebra and be sure that the Algebra & Graphics view is selected in the Perspectives panel.
2.) Select the Segment between Two Points tool, click on (0,0) and click on (5,0) to construct segment AB. Show the label of the points, and rename point B to L.
3.) Create a point on AL. You may not see the segment, so before doing this, hide the axes by clicking the Axes icon in the upper left of the Graphics View. If the icons are not displayed, click the arrow.
4.) Rename the recently created point to D. Move the point and notice that it can only move between A and L.  Now, hide point L and display the axes. AD will be the width (lower base) of the rectangle.
5.)  We now determine the width and the height of the rectangle. First, we want to determine the AD which is the width. To do this, we get the x-coordinate of D (Why?). To get the x-coordinate of D, type w = x(D) in the Input bar and press the ENTER key. This means that the value of w, a declared variable, will be the x-coordinate of point D which is the same as the length of AD.
6.) Next, we compute for the height h of the rectangle. Type h = (10 – 2w)/2 in the input bar and press the ENTER key. Notice the values of h and were added to the Algebra view.
7.) Next we create point B with coordinates (0,h). To do this, type B = (0,h) in the Input bar and press the ENTER key. This will be the third point on the rectangle.

8.) Move point D. What do you observe?
9.) Next, we locate the fourth vertex of the rectangle. The fourth vertex C will have the y-coordinate the same as B and x-coordinate the same as D. Therefore, we type C = (x(D), y(B))
10.)  Now, we use the polygon tool to construct rectangle ABCD. Click the Polygon tool and then click the points in following order: point A, point B, point C, point D and, again, point A to close the figure.
11.)  Now, let us display the area of the polygon. Right click the interior of the rectangle, then click Object Properties to open the Preferences window. In the Basic tab of the Preferences window, check the Show Label check box and choose Value from the drop down list box. Close the window.

12.)  Move point D. What do you observe? What length of AD gives the rectangle the largest area?
13.)  Now, we create point P, type P = (w, poly1). Note that poly1 is the name of the rectangle and its value is area of the rectangle (see the Algebra view).
14.)  Right click on point P, then click check Trace On. This will trace the path of point P.

15.)  Move point D. What do you observe? What can you say about the curve formed by the traces of point P? Explain why your observations are such.
16.)  Solve the problem algebraically. What is the relationship between the equation formed from getting the solution of the problem and curve formed by traces of point P?
1 40 41 42 43 44