Solving Rational Inequalities and the Sign Analysis Test

In this post, we are going to learn the steps in solving rational inequalities and see why we are doing them. For discussion’s purposes, let’s take the inequality

\dfrac{x - 1}{x^2 - 25} \geq 0

as an example.  In solving rational inequalities, first we get its critical values, then use the values to determine the intervals, and finally, test the values in each interval to see if they satisfy the inequality or not. Those that satisfy the inequality are included in its solution set.

Getting the Critical Values

To get the critical values, we equate the numerator and the denominator of the inequality to 0 (if applicable). If we think of the inequality as a function, that is, if we let

f(x) = \dfrac{x - 1}{x^2 - 25},

then equating the numerator to 0 means getting the zeroes of that function. Graphically, the zeroes are the intersections of the graph of the function and the x-axis. In the example above, when we equate x - 1 = 0, we get x = 1. This is where the graph will intersect the x-axis.

In equating the denominator to 0, we determine the values of x where there are holes or vertical asymptotes. If we factor both the numerator and denominator completely, the zeroes of the factors that we can cancel are the holes, otherwise vertical asymptotes. In the given above, equating the denominator to 0 only gives us asymptotes.

x^2 - 25 = 0
(x + 5)(x - 5) = 0
x = 5, = -5.

From the equation above, the vertical asymptotes of the function are at x = 5 and x =-5. Now that we found all the three critical points, we plot them on the number line. These points divide the number line into four intervals.
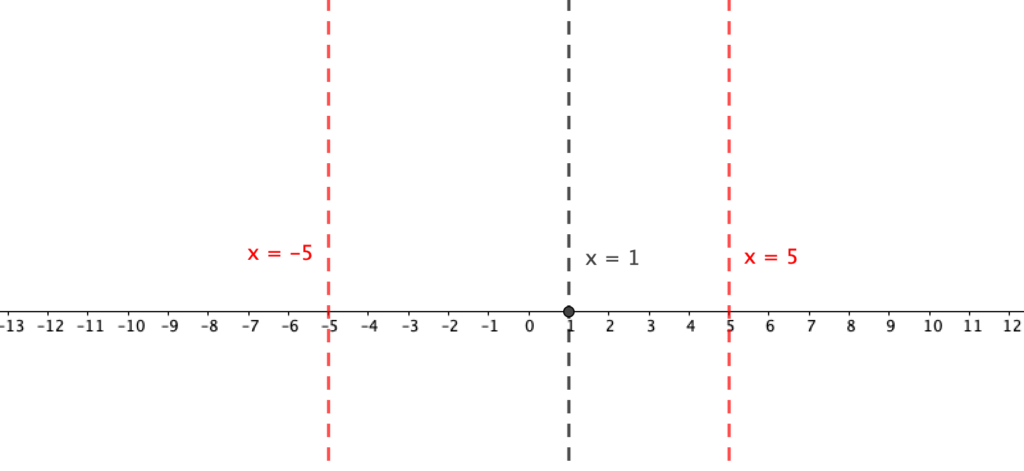
The criticial points divide the number line into four intervals.

Sign Analysis Test

Now that we identified the critical values, we do the sign analysis test. In this test, we choose a number from each interval and substitute it to the inequality to see if the resulting value satisfies the inequality. Since \frac{x - 1}{x^2 - 25} \geq 0, we are looking for values of x that will make the expression \frac{x-1}{x^2-25} either positive or 0.

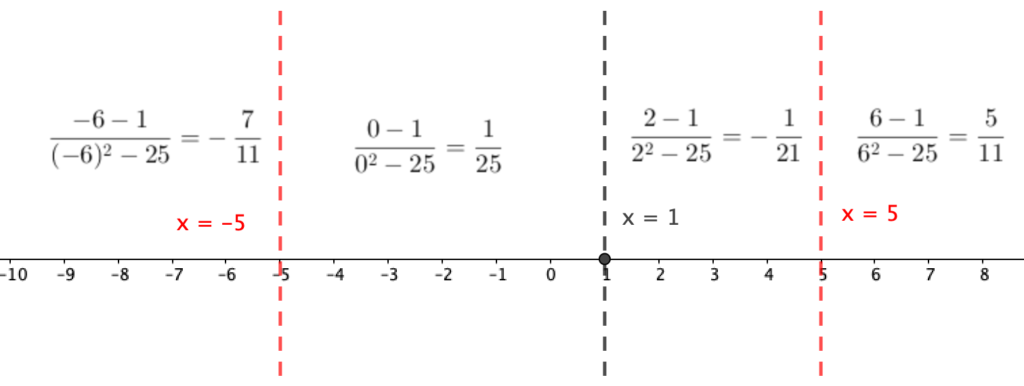
In testing the intervals, if we choose x = -6, x = 0, x = 2, and x = 6. Substituting these values to the inequality give us

-\dfrac{7}{11}, \dfrac{1}{25}, -\dfrac{1}{21}, \dfrac{5}{11},

respectively.  This means that the intervals containing \frac{1}{25} and \frac{5}{11} are the solutions to the inequality.

We now test the critical values and see if they are included in the solution set. In the inequality above, since x = 1 will make the inequality 0, it is therefore included in the solution. However, x = 5 and x = -5 are not included as solutions because they will make the denominator 0 and will make the rational expression undefined. Therefore, the solutions are the intervals that contain positive values, includes x = 1, and exclude x = 5 and x = -5. In interval notation, the solution set is (5,1] \cup (5, \infty).

Interpreting the Solution

We are looking for positive values of x that will make the inequality

\dfrac{x - 1}{x^2 - 25} \geq 0,

true and obtained the solution (5,1] \cup (5, \infty). In the function

f(x) = \dfrac{x - 1}{x^2 - 25},

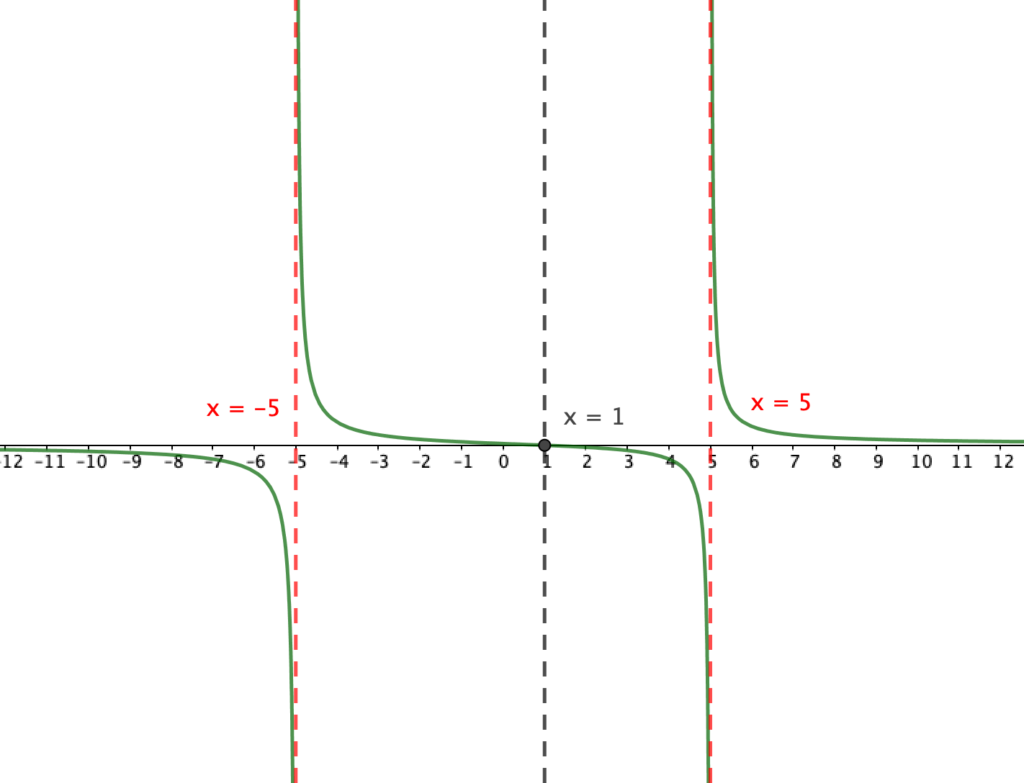
the values which are greater than 0 are the parts of the graph above the x-axis. As we can see, these are the intervals (5,1] and (5, \infty).

We can also verify the critical values x = 5 and x = -5 from graph. They are vertical asymptotes. Lastly, the value x = 1 is the intersection of the graph and the x-axis.
On the Job Training Part 2: Framework for Teaching with Technology

In the previous post, I have shared with you about our two on the job trainees (OJTs) whom I trained for six weeks. They are currently studying BS in Secondary Education major in Mathematics. They are going to graduate next year and one of the requirements to graduate is a 6-week on the job training related to teaching. This is different from their internship where they will teach in actual class.

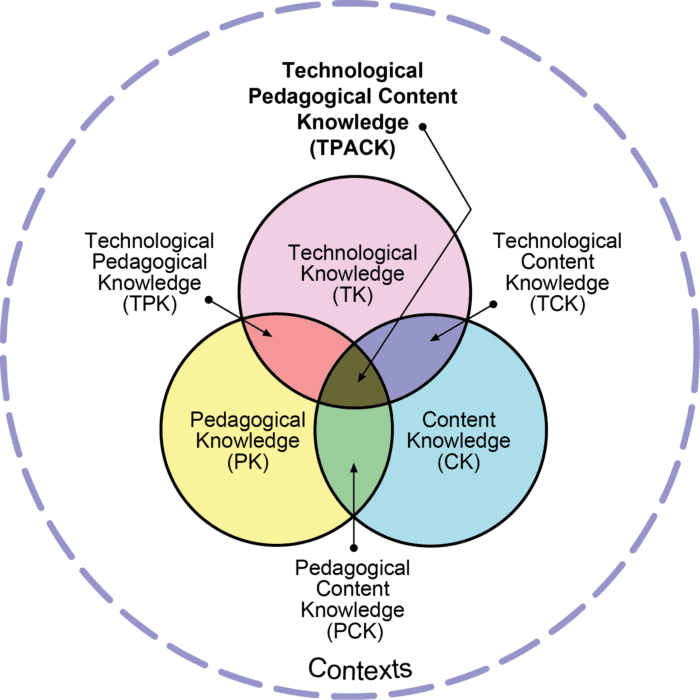
During the first week, my goal was to familiarize them with the theories in teaching mathematics with technology. This will give them a theoretical background of technology integration and would help them develop lessons with a framework in mind. One of their readings is the Technological and Pedagogical Knowledge Framework (TPACK) by Khoeler & Mishra (2006). The TPACK suggests that there are three types of knowledge are needed to teach mathematics (and other subjects) with technology effectively: technology, pedagogy, and content. I will be posting the details of this framework later. To give the trainees a bit of context and history, I also let them read the origin of TPACK which is Shulman’s Pedagogical Content Knowledge (PCK) (Shulman, 1986).

Technological and Pedagogical Content Knowledge (Mishra & Koehler, 2006)

I let the two OJTs summarize the article and at the end of the week we discussed the framework. I asked their opinion of the frameworks, their advantages and disadvantages, and how they think the framework can be used in teaching mathematics. There was no time for them to read more articles, so I incorporated Ball’s Mathematics for Teaching Framework during our discussions.

By the end of the week, the two OJTs were excited since during the next week, they would be exploring GeoGebra.

For those who are interested to read the articles I mentioned above, I have listed the references below.  The source of the image can be found here.

References

Koehler, M., & Mishra, P. (2009). What is technological pedagogical content knowledge (TPACK)?. Contemporary issues in technology and teacher education9(1), 60-70.

Shulman, L. S. (1986). Those who understand: Knowledge growth in teaching. Educational researcher15(2), 4-14.

On the Job Training: Using GeoGebra in Teaching Math

For the last several years, our Institute has been accepting on the job trainees from nearby universities. These trainees are undergraduate students taking up bachelor’s degree in education. As for our group, we are accepting students who are taking education major in mathematics.

This year, we have accepted two students who are on their third year of university studies. I have been handling them already for three weeks of their 6-week course. In this post and the next several posts, I will be sharing our activities during the training.

During our first meeting, the two students shared that they wanted to deepen their understanding on content and strategies in teaching mathematics. Since my specialization is on the use of technology, I have designed their training with the focus of integrating technology in teaching mathematics. This includes familiarization with various theoretical frameworks used in teaching mathematics using technology, using a software in creating teaching and learning materials, and developing lessons with technology integration. Once a week, we also discuss key content topics in high school mathematics and various ways to teach them.

The GeoGebra Interface (via Wikipedia)

At the end of the training, the students are expected to develop applets and lessons using GeoGebra. They will implement the lessons with me and my colleagues as audience. After the implementation of the lesson, we will comment on how the lessons can be improved.  Their last task is to revise the lesson. Their major output is a lesson plan.

For those who are not familiar with GeoGebra, it is free software that can be used for teaching and learning mathematics. You can download it here and there are various tutorials on learning the software here. GeoGebra is available on Windows, Mac, Linux, iOS and Android operating systems.  You can use it on laptops, tablets, and mobile phones.

1 2 3 4 406