GeoGebra Tutorial 20 – Spreadsheet, Slider and Curves of Best Fit
This the 20th tutorial of the GeoGebra Tutorial Series. If this is your first time to use GeoGebra, you might want to read first the GeoGebra Essentials Series.
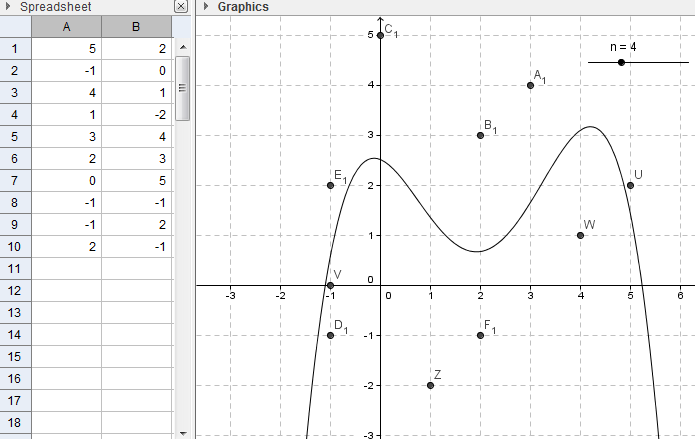
In this tutorial, we use the spreadsheet window to input coordinates of points that will be plotted in the Coordinate plane. We use the Best Fit Line tool to construct a line of best fit of the plotted points. Finally, we also use the Fitpoly command and the Slider tool to construct polynomial (with varying degrees) curves of best fit. The output of our tutorial is shown below.
You can view the output of this tutorial here.