This is the 21st tutorial of the GeoGebra Intermediate Tutorial Series. If this is your first time to use GeoGebra, you might want to read the GeoGebra Essentials Series.
In this tutorial, we investigate what happens if we multiply the coordinates of the vertices of a triangle with a constant. First, we plot three points that will be the vertices of a triangle, and then draw the triangle using the Polygon tool. Next, we will construct slider k, and see what happens if we multiply the coordinates (x1,y1), (x2,y2) and (x3,y3) of the vertices of the triangle by k. We also explore the relationship between the original triangle and the triangles with coordinates (kx1,ky1), (kx2,ky2) and (kx3,ky3).
You can view the output of this tutorial here.
Step-by-Step Instructions
|
1. Open GeoGebra and select Spreadsheet & Graphics from the Perspectives menu. |
|
2. To show labels of points during construction, click the Options menu, click Labeling, then click New Points Only. |
 |
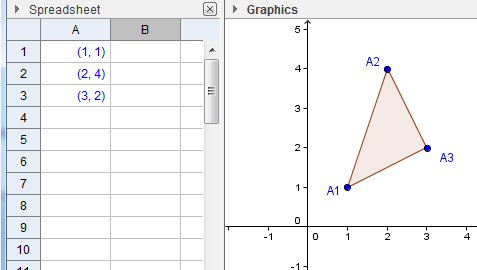
3. In the spreadsheet, type the following entries: (1,1) in cell A1, (2,4) in cell A2 and (3,2) in cell A3 (see Figure 1). Notice, that GeoGebra automatically plots the points with the given coordinates and uses cell addresses as name of points. |
 |
4. Now, click the Graphics view, select the Polygon tool and click the points in the following order: A1, A2, A3 and then A1 to construct the triangle.
|
 |
5. We now construct slider k. To construct the slider, select the Slider tool and click a vacant space in your Graphics view to display the Slider dialog box (see Figure 2). |
|
6. In the dialog box, replace the default name with k in the Name box, leave the other values in the dialog box as is, and then click the Apply button. |
|
|
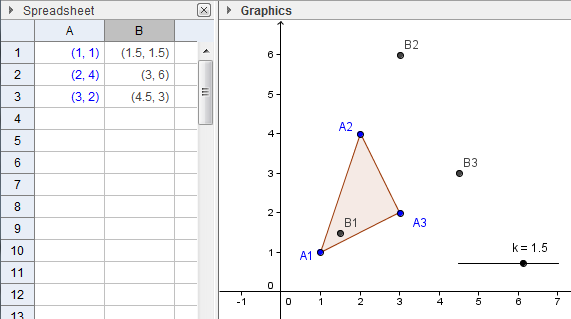
7. We now multiply the coordinates of points A1, A2 and A3 with the value of k. To do this type the following values: =A1*k in cell B1, = A2*k in cell B2 and =A3*k in cell B3. |
|
|
8. Move the Slider and be sure that k does not equal 1, so that the points will not overlap.
|
|
|
9. Use the Polygon tool to construct triangle B1B2B3. Move the sliders. What do you observe? |
|
10. Notice that when k = 1, the corresponding points overlap and the names also overlap. We will use the Advanced tab to hide points B1, B2 and B3 when k=1. To do this, highlight B1 up to B3 in the Spreadsheet window, and then right click the selection and click Object Properties to display the Preferences dialog box. |
|
11. In the Preferences dialog box, select the Advanced tab and type k ≠ 1 in the Condition to Show Object text box and click the Close button. You can find the ≠ symbol in the drop down list box right next to Condition to Show Object text box. This means, that GeoGebra will not show the points B1, B2 and B3, when k=1. |
|
12. Move the vertices of triangle A1A2A3. What do you observe? Is there a relationship between the two triangles? |
|
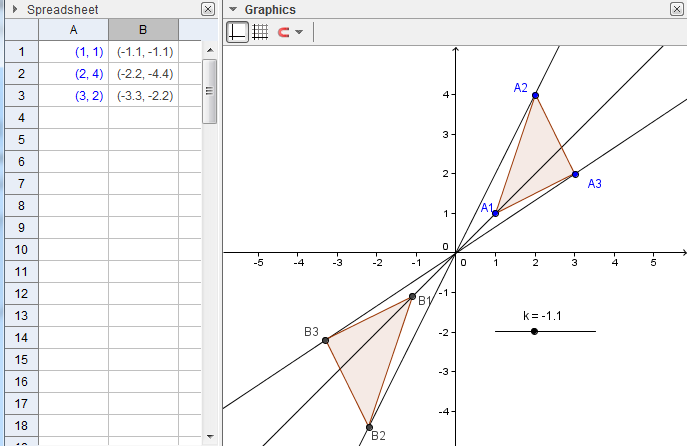
13. Connect the the corresponding points of the triangle with a line – that is connect A1 to B1, A2 to B2 and A3 to B3. What do you observe? |
|
14. Investigate the figures, and use additional tools if necessary. Write your observations and make conjectures about them. |