5 Free Math Software For Teaching and Learning Mathematics

Years ago, I met a Japanese professor who eventually became my adviser during my one and a half year stay in Japan.  CRICED, the institute he was working also develops mathematics software in elementary and secondary schools. Below are 5 of the math software that they have developed.

1.) Grapes – a graphing software that allows users to draw most functions discussed in the secondary curriculum.

2.) Geometric Constructor –  a dynamic geometry software for teaching and learning geometry. Allows users to publish contents on the web.

3.) DbookPro – a tool for developing digital textbook. This can be done by scanning textbooks and or importing textbooks images. I have written two manuals of dbook (basic and advanced) and you can view the sample output of a dbook here.  You can download dbookPro here.

4.) Geometry Construction Language (GCL) Editor – an xml-based software used for creating educational materials in Flash.

5.) DGraph – Used for making and editing graphs from data and equation.

I have only tried 2 of these software (dbookPro and Grapes), but you might want to explore all of them.

Gnuplot Tutorial 1 – Graph Basics

Gnuplot is a command-driven graphing software. It is free and available in Windows, OS2, DOS and Linux. If you are using Windows, then your Gnuplot window would look like Figure 1.
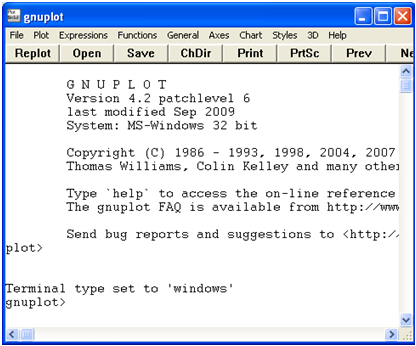
Figure 1 – The GNU Plot window.

The text gnuplot> at the bottom left of your Gnuplot window is called the Gnulot prompt. It is used for typing command just like in the Windows command prompt.

In this tutorial, we are going to plot the graph of the sine function and modify several options of our output. To plot the graph of the sine function, type plot sin(x) in your GNUPlot prompt (see Figure 2) and then press the ENTER key.
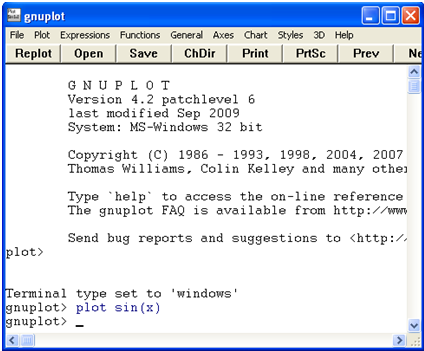
Figure 2 – THE GNUPlot window after plotting the graph of the sine function.

Figure 3 shows the graph of the sine function produced by Gnuplot after pressing the ENTER key. Notice that the x and y axes have are hidden and have no labels.   The x-axis interval is 5 and the y-axis interval is 0.2. We can also notice that the range of the x-axis displayed on the window are from -10 to 10 and the range of they y-axis displayed is from -1 to 1. We will change these settings one-by-one.

Figure 3 – The graph of the sine function.

In this plot we are make our graph look like the one shown in Figure 4. Our modifications are the following:

1.)    Write a title “Graph of the Sine Function”.
2.)    Label the x-axis with “x”
3.)    Label the y-axis with “y”
4.)    Show the x and the y-axis.
5.)    Change the range of the x-axis from -7 to 7.
6.)    Change the range of the y-axis from -2 to 2.
7.)    Set the interval of the x-axis interval to 1
8.)    Set the interval of the y-axis interval to 1.
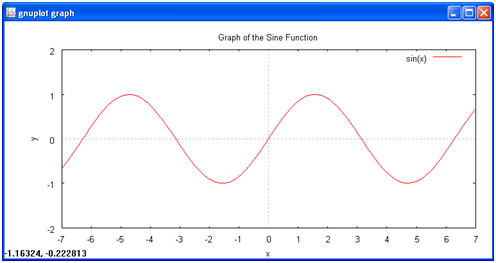
Figure 4 – Modifed graph of the sine function.

To make the modifications above, just type the commands in the Command column and then press the ENTER key after typing. Remember that after pressing the ENTER key after a command is written, you can always view the changes by typing replot and pressing the ENTER key again.

Command Notes
1.) set title “Graph of the Sine Function” Writes the title Graph of the Sine Function at the top center of the graph. Try typing replot in the GNUPlot prompt and press the ENTER key to see the changes in the graph.
2.) set  x label “x” Labels the x-axis “x”
3.) set ylabel “y” Labels the y-axis “y”
4.) set zeroaxis Shows the x and y axis
5.) set xrange [-7:7] Sets the Cartesian plane x-axis from -7 to 7.
6.) set yrange [-2:2] Sets the Cartesian plane y-axis from -2 to 2.
7.) set xtics (-7,-6,-5,-4,-3,-2,-1,0,1,2,3,4,5,6,7) Set the intervals of the x-axis to 1 and label the intervals. We chose from -7 to 7 because this is the range of our x-axis.
8.) set ytics (-2,-1, ,0,1,2) Set the intervals of the y-axis to 1 and label the intervals. We chose from -2 to 2 because this is the range of our y-axis.

And we are done. To view your graph, type replot and then press the ENTER key. Your graph should look like Figure 4.

GNUPlot can, of course, plot graphs that are a lot more complicated than what we have done above. It is capable of 3-dimensional graphs such as the one shown below.

We are going to discuss them in the future GNUPlot tutorials, so keep posted.

Geonext Tutorial 1 – Constructing an Equilateral Triangle

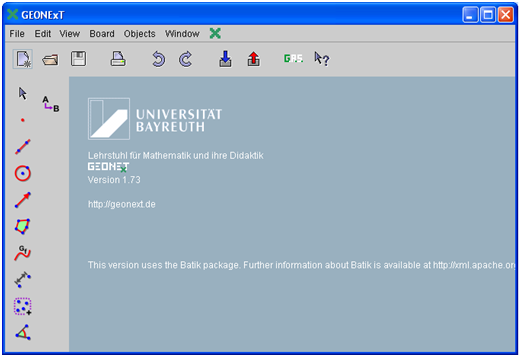
Geonext is aJava-written interactive and free geometry software. It is developed by the Lehrstuhl für Mathematik und ihre Didaktik (Chair of mathematics and its didactics) of the University of Bayreuth in Germany and released under the GNU General Public License.

Figure 1 - The Geonext Window.

1.) Click the New Board button.
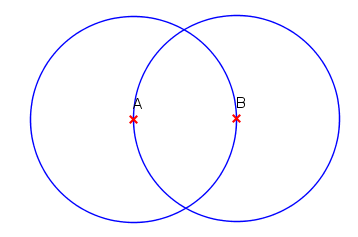
2.) To draw a circle with center A and passing through B, click the Circle tool, click the drawing board to determine the center of the circle, then click another location to determine its radius. Notice that Geonext, automatically names the points in alphabetical order.


3.) With the Circle tool still active, click point B and then click point A to create a circle, with center B passing through point A.

Figure 2 - Circles with centers A and B.

4.) Click the Point tool, and click one of the intersections of the two circles. Notice that a point D was also constructed.
5.) Next, we hide the circles and point D, leaving only points A, B and C on the drawing area. To hide the objects, click Objects menu from the menu bar, click Special Properties and click Hide. Click the two circles.

Figure 3 - The circumference of the two circles are hidden.

Notice, that hidden objects are colored pitch. The figure above is shown when you click point D. That means that Geonext is asking you which object to hide. A circle ca, cb or point D. Since both circles are already hidden, you just have to click point D.


6.) Next, we will use the Polygon tool to draw triangle ABC. To draw the triangle, click the Polygon tool, click point A, click point B, click point C and then click point A to close the triangle.
Q1: Move the vertices of the triangle. What do you observe?
7.)Now, to verify that the triangle is equilateral, we can do two things: reveal the measure of the interior angles or the side lengths.  To reveal the side length, click Texts and Calculations, then click Measure Distance, then click the three sides of the triangle.
8.) You can also measure the angles using the angle tool and using three points. For example, if you want to measure angle B, click the Objects menu, click Texts and Calculations, then click Measure Angle, then click point A, click point B and click point C.
9.  Move the vertices of the triangle. What do you observe?
Q2:.  Explain why ABC is always an equilateral triangle.
10.  Click the File menu and click Save if you want to save your file.

There is also a similar construction here using GeoGebra.

1 2