Microsoft Mathematics Tutorial 7 – The Ink Input

This is the seventh tutorial in the Microsoft Mathematics Tutorial Series. In this post, we learn how to use the Ink input of Microsoft Mathematics.

Ink Input

Microsoft Mathematics has handwriting support that enables users to write problems and solve equations using the pen in Tablet PCs or even just a mouse when using a computer.  This will enable solving equations instantly. The Ink tool is available in both the Worksheet and Graphing tabs.

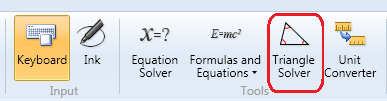
To use the Ink input, click the Home tab, and then click the Ink option from the toolbar as shown in the first figure.  This will display the Ink input area as shown below.

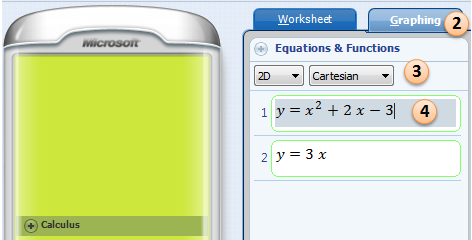
In the Ink input area, write the equation using the pen tool. Notice that as you write, the text appears in the box above the input area. Use the eraser and selection tools if necessary.

After writing the equation, press the ENTER key on the keyboard. The answer and the solution steps appear in the output pane.

Microsoft Mathematics Tutorial 5 – Using the Triangle Solver

This is the 5th tutorial in the Math and Multimedia’s Microsoft Mathematics Tutorial Series.  In this post, we use the Triangle Solver to construct triangles with specified side lengths and/or angle measures.

The Triangle Solver is very useful in constructing accurate triangle drawings. To construct the desired triangle, the user can specify the length of the sides or the measure of interior angles.

To display the Triangle Solver, click on the Triangle Solver icon on the toolbar. In the Triangle Solver dialog box,  type the side lengths and/or angle measures of the triangle you want to construct.  For example, triangle ABC where a = 4, c=5 and B = 30˚ (no need to insert the ˚ sign) will construct the triangle shown below. Notice that the Triangle Solver automatically computes the missing side lengths and angle measures. The blue numbers were typed by the user, and the green numbers were automatically computed.  » Read more

Microsoft Mathematics Tutorial 4 – Plotting Graphs

This is the fourth tutorial of the Microsoft Mathematics Tutorial Series.

In this tutorial, we learn how to plot 2 and 3 dimensional Cartesian graphs and 2 dimensional polar graphs.  We also learn how to modify the settings of the Graphing window such as plotting range and proportional display.

1. Open Microsoft Mathematics.

2.  Select the Graphing tab.

2. Under Equations and Functions, be sure that 2D and Cartesian are selected.

3. Type y = x^2 + 2x - 3 and y = 3x. Use the ^ symbol for exponent.

4. After the equations have been entered, click the Graph button. » Read more

1 2 3