Geonext Tutorial 1 – Constructing an Equilateral Triangle

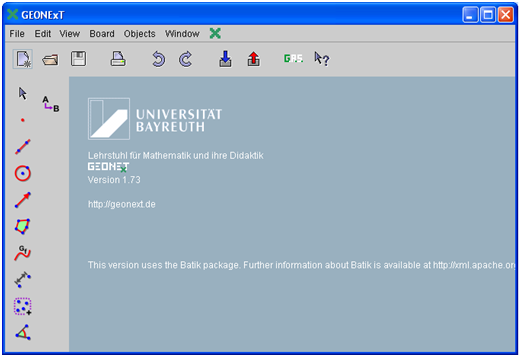
Geonext is aJava-written interactive and free geometry software. It is developed by the Lehrstuhl für Mathematik und ihre Didaktik (Chair of mathematics and its didactics) of the University of Bayreuth in Germany and released under the GNU General Public License.

Figure 1 - The Geonext Window.

1.) Click the New Board button.
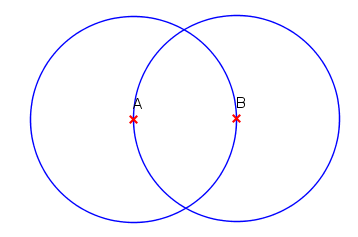
2.) To draw a circle with center A and passing through B, click the Circle tool, click the drawing board to determine the center of the circle, then click another location to determine its radius. Notice that Geonext, automatically names the points in alphabetical order.


3.) With the Circle tool still active, click point B and then click point A to create a circle, with center B passing through point A.

Figure 2 - Circles with centers A and B.

4.) Click the Point tool, and click one of the intersections of the two circles. Notice that a point D was also constructed.
5.) Next, we hide the circles and point D, leaving only points A, B and C on the drawing area. To hide the objects, click Objects menu from the menu bar, click Special Properties and click Hide. Click the two circles.

Figure 3 - The circumference of the two circles are hidden.

Notice, that hidden objects are colored pitch. The figure above is shown when you click point D. That means that Geonext is asking you which object to hide. A circle ca, cb or point D. Since both circles are already hidden, you just have to click point D.


6.) Next, we will use the Polygon tool to draw triangle ABC. To draw the triangle, click the Polygon tool, click point A, click point B, click point C and then click point A to close the triangle.
Q1: Move the vertices of the triangle. What do you observe?
7.)Now, to verify that the triangle is equilateral, we can do two things: reveal the measure of the interior angles or the side lengths.  To reveal the side length, click Texts and Calculations, then click Measure Distance, then click the three sides of the triangle.
8.) You can also measure the angles using the angle tool and using three points. For example, if you want to measure angle B, click the Objects menu, click Texts and Calculations, then click Measure Angle, then click point A, click point B and click point C.
9.  Move the vertices of the triangle. What do you observe?
Q2:.  Explain why ABC is always an equilateral triangle.
10.  Click the File menu and click Save if you want to save your file.

There is also a similar construction here using GeoGebra.

Can we Graph Inequalities in GeoGebra?

Update (Oct 2, 2010): The GeoGebra 4.0 version can now graph linear inequalities. Click here to read about it.

I wrote this because there are a lot of searches in my Blog Stat searching how to graph inequalities in GeoGebra. UNFORTUNATELY, GeoGebra is still working on this feature. I emailed Markus Hohenwarter, the creator and lead programmer of GeoGebra, two years ago requesting for this feature but he told me that he was still working on more important features.

There are, however, GeoGebra users who found a way to improvise. Some of the links are shown below.

http://www.geogebra.org/en/upload/files/english/Daniel_A_Kaufmann/Inequalities.htm

http://www.geogebra.org/en/upload/files/english/dtravis/sys_of_line_inequalities.html

http://www.geogebra.org/en/upload/files/italian/remigio/diseq/diseq.html

If you are just looking for a software that can graph inequalities, you can try  Graph Calculator 3D which has a free edition. The screen shot of graphs of systems of inequalities is shown below.

Notice, that graphing inequalities in this software is very easy. First, you just have to type the equations or inequalities (upper left of the diagram), then choose the graph attributes (middle left of the diagram). You can also choose 3-dimensional graphs.

I will have a separate tutorial post on how to use the Graph Calculator 3D  soon.

GeoGebra Tutorial: Graphing Functions Using GeoGebra

Basic Graphing

You can graph in by typing equations of functions in the Input box.

Figure 1 - The GeoGebra Window

Type the following equations of functions in the Input box and press the ENTER key after each equation.

  1. y = 2x + 3
  2. f(x) = -3x + 5
  3. 2x – 3y + 6 = 0
  4. g(x) = sin(x)
  5. y = x^3 – 1

Notes:

  • You can type linear equations in the following forms:  y = ax + b, f(x) = a(x) + b or ax + by + c = 0.
  • The * is used in multiplication and ^ is used in exponentiation. For example you want to graph, y = 2(x – 3)2, then you should enter y = 2*(x-3)^2.

Properties of Graph

You can change the  labels, colors, thickness and other properties of graphs (and other objects) in GeoGebra. In this tutorial we are going to change the color, label and thickness of the graph g(x) = sin(x).

To change the properties of the graph g(x) = sin(x), do the following:

1.)    Right click the graph of the sine function then click Object Properties from the context menu.
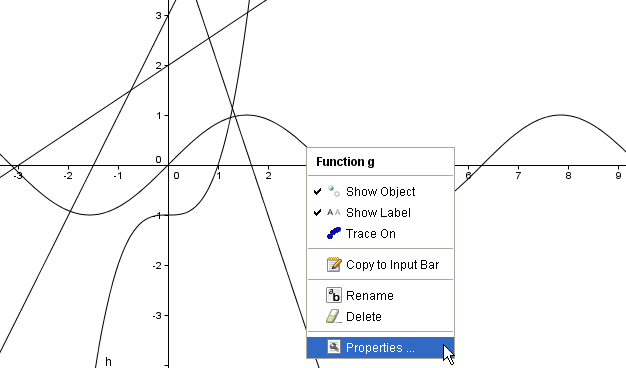
Figure 2 - The context menu that appears when you right-click a graph

2.)    In the Basic tab, be sure that the Show label check box is checked.

3.) Choose Name and Value from the Show label drop-down list box.

Figure 3 - The Basic tab of the Properties dialog box

4.)    To change the color, click the Color tab, then choose your color from the Color palette.

5.)    To change the thickness of the graph, click the Style tab, move the slider bar to 5.
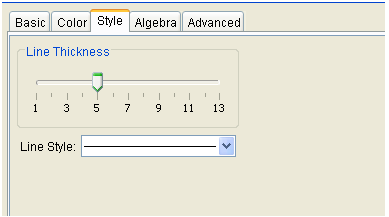
Figure 4 - The Style tab of the Properties dialog box.

6.)    Click the Close button

Exercise: Change the properties of the other graphs. Explore the options in the Properties dialog box and see their effects to the graphs.

You may also want to view another tutorial on graphs and sliders.
1 2