GeoGebra Tutorial 20 – Spreadsheet, Slider and Curves of Best Fit
This the 20th tutorial of the GeoGebra Tutorial Series. If this is your first time to use GeoGebra, you might want to read first the GeoGebra Essentials Series.
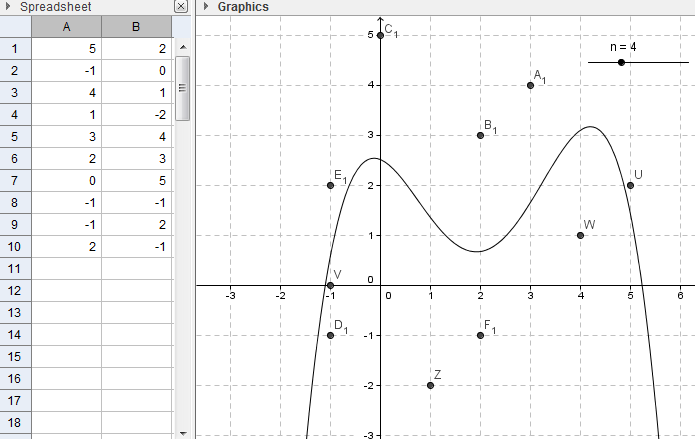
In this tutorial, we use the spreadsheet window to input coordinates of points that will be plotted in the Coordinate plane. We use the Best Fit Line tool to construct a line of best fit of the plotted points. Finally, we also use the Fitpoly command and the Slider tool to construct polynomial (with varying degrees) curves of best fit. The output of our tutorial is shown below.
You can view the output of this tutorial here.
Step-by-Step Instructions
| 1.) Open GeoGebra and select Spreadsheet & Graphics from the Perspectives menu and display the grid lines using the Styling bar. | |
| 2.) To show labels of points only, click the Options menu, click Labeling, then click New Points Only. | |
|
|
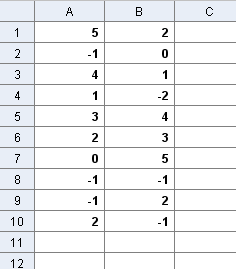
3.) Enter the following numbers in the spreadsheet. The pairs or numbers will be the coordinates of 10 points, those at column A will be the x-coordinates and those at B the y-coordinates.
 Figure 2 |
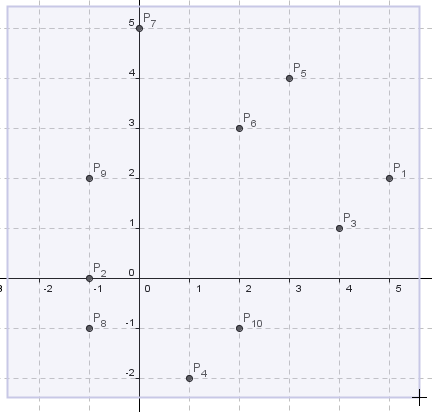
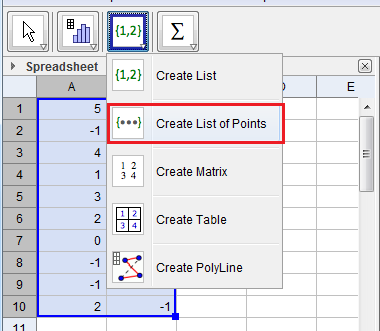
| 4.) To plot the points, highlight the points from A1 to B10, select the Create List of Points to view the Create List of Points dialog box. | |
| 5.) In the Create List of Points dialog box, leave the other options as is and then click the Create button. Notice that the points appear in the Graphics view. Note that the name of the list is list1. | |
6.) To create a line of best fit, click the Graphics view, select the Best Fit Line tool, and drag across all the points. Note: In future construction of best fit line, if your points are too scattered, and you can’t drag across all of them, you can use the Fitline command instead of the Best Fit Line tool. You can just type Fitline[Listname] and then press the ENTER key on your keyboard.
 Figure 4 |
|
|
|
7.) Move several points. What do you observe about the line? What do you observe about the distribution of the points with respect to the line? |
| 8.) We now create a slider n for our polynomial of best fit. This way we can choose the curve of best fit with varying degree. To create a slider, select the Slider tool, and then click on the Graphics view to display the Slider dialog box. | |
| 9.) In the Slider dialog box, select the Number button, change the name to n, min to 1, max to 10, and increment to 1. | |
| 10.) Since the degree is from 1 through 10, we will not need the line of best fit we created earlier. Delete the line by clicking it and clicking the Del key from your keyboard. | |
| 11). To construct the curve of best fit, display the Input bar using the View menu, type Fitpoly[list1,n] in the Input bar, and then press the ENTER key on your keyboard. That is, we want a polynomial of best fit with degree n for points on list1. | |
|
|
12.) Move slider n and observe how the curve behaves. Move the points. What do you observe? |

