Math Expressions and Graphs in Google Docs with g(Math)

Last week, I wrote about a tutorial on how to create math expressions in a Google Forms using Latex. Embedding of Latex in Google Docs documents can be made using the new g(Math) Google Docs Add On. Although Google Docs has a built in equation editor, the addition of Latex through g(Math) can make embedding of more complicated equations possible.

In addition to Latex, you can also create graphs using g(Math). Once you have added this add on, you can create graphs using the side bar of your Google Docs window.

Watch John McGowan, creater of g(Math), demonstrates how to use g(Math) on Google Docs.

For those who are not familiar with Latex, it is a typesetting system used to create scientific documents. It can also be used to create complicated math expressions. You can read my introduction and brief tutorial about latex in case you don’t know about it.
 

Create Latex Documents with Lyx

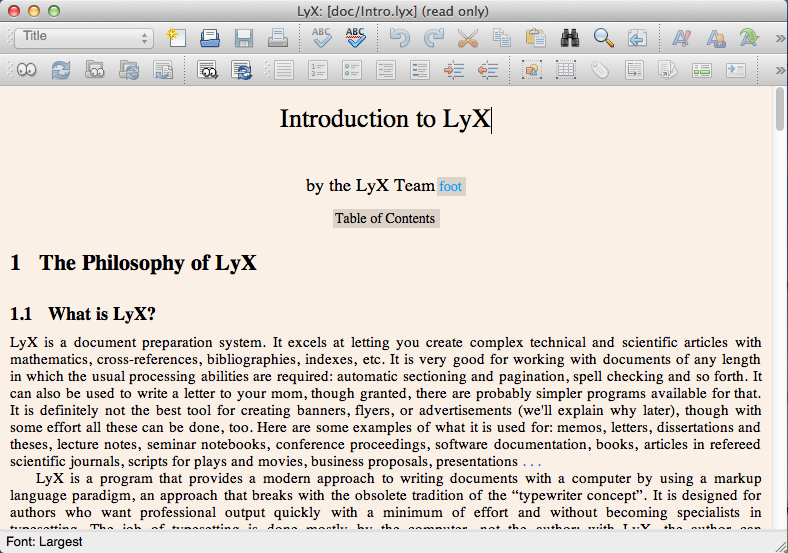
If you are creating a lot of scientific documents or numerous documents that contains math equations, then you might want to check out Lyx. I have been using Lyx for a week and I really like it.

Lyx is a free and open-source document processor built on top of the Latex typesetting system. It has the power of Latex, so it can be used to create books, notes, theses, and academic papers. It is free and is available for Windows, Mac OS X, Linux, UNIX and OS/2.

lyx

Lyx has a lot of great features, some of which are listed below.

  • Graphical user interface with menus
  • Automatically numbered headings, titles, and paragraphs, with table of contents
  • Copy paste to and from Latex source code
  • Bibtex support
  • WYSIWYG for cropping, rotation, and scaling of images
  • WYSIWYG table and math editors
  • Export to Docbook, SGML, XHTML, and plain text
  • more
1 2 3 4