How to Create Desmos Graphs with Sliders in 3 Steps
Desmos Calculator is one of the great free calculators available online. You can use it to create graphs, plot table of data, evaluate equations and even explore transformations. But my favorite feature of Desmos are the sliders. Recently, they have added an animation feature for sliders.
In this post, I am going to show you how easy it is to create Desmos graphs with sliders in order to explore family of functions. To follow this tutorial, go to the Desmos website.
How to Create Desmos Graphs with Sliders in 3 Steps
Step 1
Type the equation of the function you want to graph. For example, you want to graph 
y = a(x-3)^2 + k.
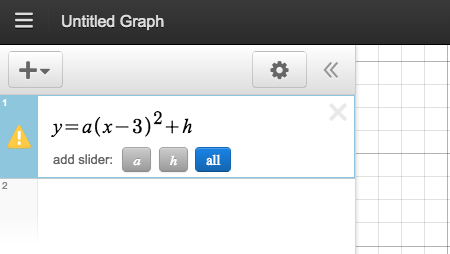
Step 2
Choose which sliders do you want to appear by clicking the all button below the slider.
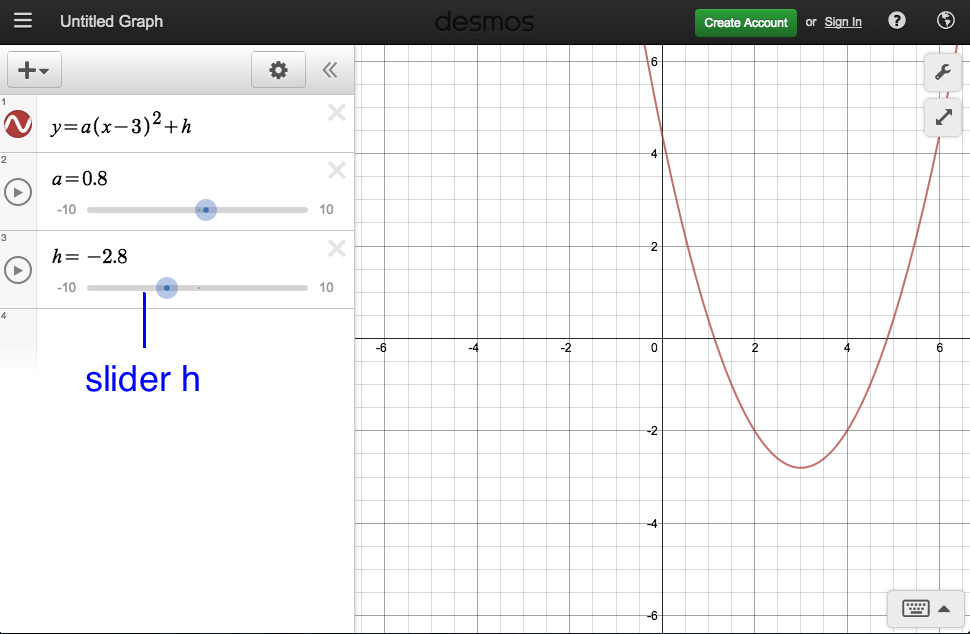
Step 3
Move the sliders or us the Play button to play the animation on the left of the sliders to see how the equations affect the graph.
Desmos is available as an online grapher, as a Google Chrome extension. It is also available on iTunes.