Maxima Tutorial 2: Algebraic Manipulation and Graphing
In Maxima Tutorial 1, we have discussed how Maxima can be used to perform numerical computations. In this tutorial, we are going to enumerate some of the capabilities of Maxima to perform symbol manipulation. Note than in each equation below, do not forget to press the ENTER key after the semicolon.
Maxima can perform algebraic operations and here are a few of its capabilities:
- Assigning values to variables and using them in computations.
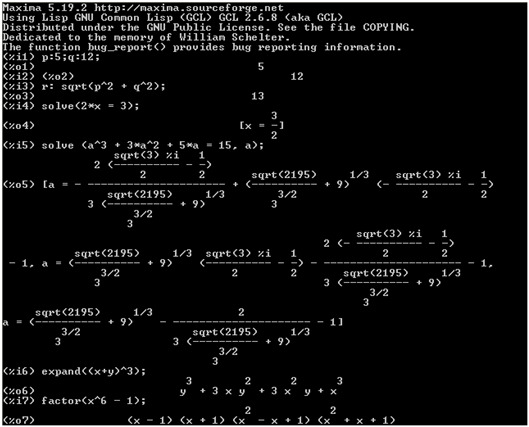
- p:5; q:12; (Press the Enter key on your keyboard after the second semicolon)
- r: sqrt(p^2 + q^2);
In a, we used the colon sign to assign values to p and q and assign them as the value of r in b.
- Solve equations in one variable
- solve(2*x = 3, x);
- solve(a^3 + 3*a^2 + 5*a = 15,a);
- ratsimp(2*a + 3*b + c – a –b +2*c);
- ratsimp(x^2 – 3*x*y + y^2 – 2*x^2 – 5*y^2);
In c, we solve for the 2x = 3 for the value of x. In d, we use * for multiplication, and ^ for exponentiation. The ratsimp command simplifies expressions.
- Expand and factor algebraic expressions
- expand((x + y)^6);
- factor (x^6 – 1);
- Solve systems of linear equations
- linsolve ([3*x + 4*y = 7, 2*x + a*y = 13], [x, y]);
- eq_1: x^2 + 3*x*y + y^2 = 0;
- eq_2: 3*x + y = 1;
- solve (eq_1,eq_2);
In a, we solved for the values of x and y in the systems of linear equation and
. In b and we defined two equations, eq_1 and eq_2, then used the two variables in d.
- Plot graphs in 2 and 3 dimensions
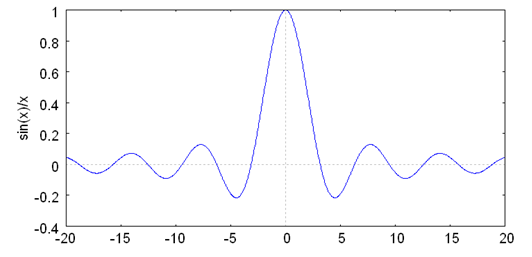
- plot2d (sin(x)/x, [x, -20, 20]); (See Figure 1)
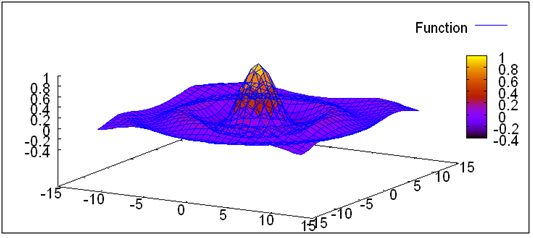
- plot3d(sin(sqrt(x^2 + y^2))/sqrt(x^2 + y^2), [x,-12, 12], [y,-12,12] (See Figure 2)


