GeoGebra Tutorial 32 – Graphing Piecewise Functions
In this tutorial, we are going to learn how to graph piecewise functions. In our example, we will graph the piecewise function
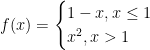
The output of our tutorial is shown below. GeoGebra has not yet developed a way to construct piecewise functions, however, its features is more than good enough for improvisation. In the construction below, we will use the function command to graph functions with specified domains. We will create manually, the two endpoints of the functions on (1,1) and (1,0). We will also use the vector tool to construct arrows.

Click the image to go to view the applet.
If you want to follow this tutorial step-by-step, you can open the GeoGebra window in your browser by clicking here. The output applet of this tutorial can be viewed here. » Read more