GeoGebra Advanced Tutorial 8 – Random Numbers and Condition to Show
In this tutorial, we will are going to create an exercise applet on plotting points. This exercise is recommended for students who were just introduced to plotting points in the coordinate plane. The user of this applet is going to drag four points to the given coordinates. Each time a point is dragged to the correct place, the text “Correct” will appear. next to the given coordinates. Click here to view the output of the tutorial.

In doing this tutorial we are going to learn how to use the randombetween command set the condition to show option.
To give you an overview of how we are going to go about the tutorial:
- We will create four points P, Q, R, and S with random coordinates. In doing this, we have to be sure that P is in quadrant 1, Q is in quadrant 2, R is in quadrant 3, and S is in quadrant 4. We will use the randomBetween command to randomize the coordinates of the four points.
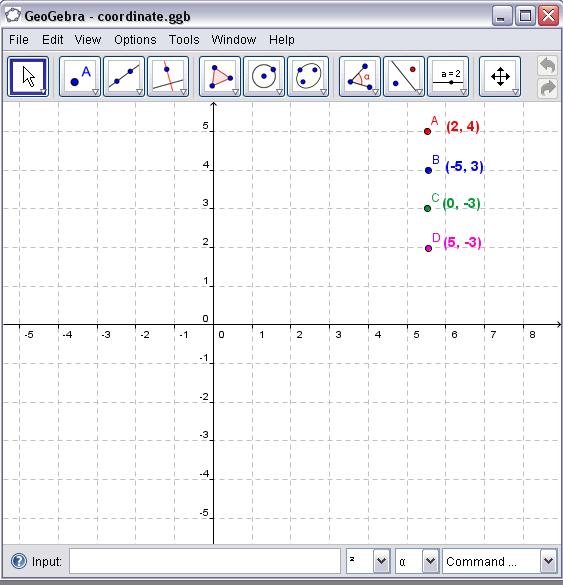
- After creating the points, we will create four points A, B, C, and D with different colors (see Figure 1). These points are the points that the users will drag.
- Next, we create four texts that will display the coordinates of P, Q, R and S, and four texts that will display the word “Correct”, each of which, have similar colors to the corresponding points. After creating the texts, we will hide points P, Q, R and S.
- Next, we want the user to drag points A, B, C and D to their correct position. The word “Correct” will be displayed if points A, B, C and D are on the right coordinates. That is, we want to display the word “Correct”, corresponding to the point with the correct coordinates. We can do this by modifying the condition to appear of the four “Correct” text boxes.
- The last part, we are going to construct an applet that our users would use. Note that every time the dynamic html is refreshed or reloaded, new random points are created.
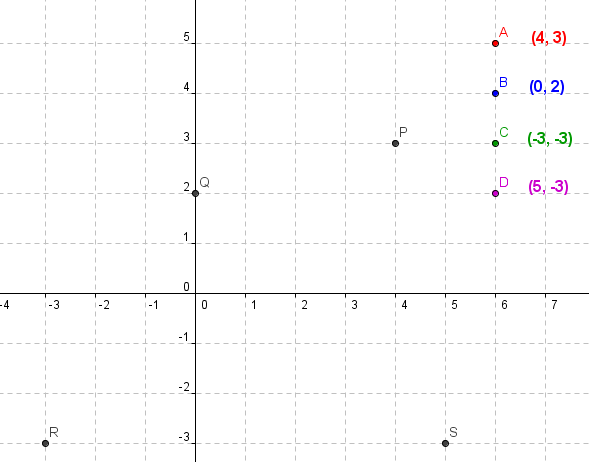
| 1 | a. Before proceeding with the tutorial, use the View menu to display the GeoGebra Grid, be sure that the GeoGebra window displays the interval -6 to 6 for y axis, and -6 to 8 for x axis, and be sure the interval both x and y axes is 1 (Options>Graphics View; set both x and y axes distance to 1).b.To begin, type P = (randomBetween[0,5], randomBetween[0,5]) then press the ENTER key. This will construct point P with coordinates (a,b) where a and b are random integers from 0 to 5. The command randombetween[p,q] generates a random integer between p and q. |
| c. For Q in the second quadrant type Q = (randomBetween[-5,0], randomBetween[0,5]); for R in quadrant 3 type R = (randomBetween[-5,0], randomBetween[-5,0]); for S in quadrant 4 type S = (randomBetween[0,5], randomBetween[-5,0]). Notice that the intervals of the random coordinates of the points made sure that they are on their appropriate quadrants. | |
| 2 | Using the New Point tool, create four points A, B, C and D with different colors. You can change the color of the points by right clicking it and choosing the appropriate color in the Object Properties dialog box. |
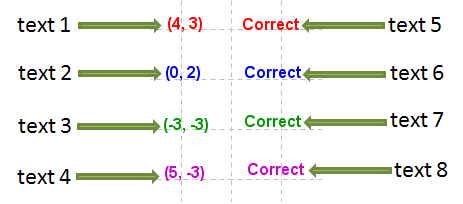
| 3 | a. Next, construct four text boxes (see text 1-4 in Figure 2) containing the coordinates of P, Q, R and S (shown by text 1 to 4). To display the coordinates of P, select Insert Text, type P in the text box and then click the OK button. |
b. Next, we construct four texts with the word “Correct” in their appropriate colors (see text 5-8).
 Figure 2 |
|
| c. Now that we have done the construction, we want our user to drag point A to (4,3) which is the coordinate of P, we want to drag B to (0,2) or the coordinate of Q and so on. Of course we can see points P, Q, R, and S, so we have to hide them. Right click the points that we want to hide, then click Show label from the context menu. | |
| 4 | a. We want to change the condition to show of text 5. We want to show the word “Correct” if A = P; that is, if point A is positioned on the right coordinates. To do this, right click text 5 (see Figure 2) and select Object Properties. In the Object Properties window, select the Advanced tab and then type A = P (see figure below) in the Condition to Show Object text box.
b. Change the Condition to Show Object of the other text boxes (text 6-8) appropriately. |
| 5 | a. Before exporting to html, positions the points, the coordinates and the “Correct” texts appropriately. Texts 5-8 can only now be seen if the points are placed on the correct coordinates. b. Now, export your file to html. Note that in order to generate points with random coordinates after dragging the points to the right coordinates, you have to refresh your browser. |

