GeoGebra 4.0 Sneak Peek 4: Graphing Inequalities
This is the fourth part of the GeoGebra 4.0 Sneak Peek Series
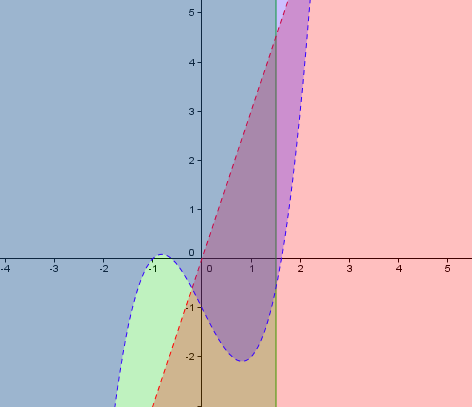
The long wait is over! GeoGebra 4.0 can now graph inequalities as shown in Figure 1.
You can construct the graph above by typing the following in the Input bar pressing the ENTER key after each inequality.
The symbol <= can also be found on the symbol box as . Just click the input bar and click the
symbol at the rightmost part of the input bar.
When we talk about inequalities, we talk about solutions. In GeoGebra 4.0, we can graph the solution of the three or more inequalities above using logical operators such as and (denoted by ∧). The graph shown in Figure 2 is the graph of the inequality (-x + y ≤ 3) ∧ (4x + 3y < 12) ∧ (-x – 2y < -2).
The inequality is a new feature in GeoGebra is not yet stable. The logical operators might still have problems with functions with degree more than one. I used the logical operator on the first three inequalities, which include one quadratic inequality, but no output graph was shown (Update: I think this is fixed now).
In the next post, we are going to discuss about the computer algebra system, the newest feature of GeoGebra.

