Graph Sketching I: 4 Easy Ways to Graph a Linear Function
This is the first part of the Graph Sketching Series. Sketching is the process of drawing a rough idea of the overall shape of the graph. A graph sketch is a rough estimate of the actual graph of a function.
In this series, we will start with the graph of linear functions, then we will proceed with polynomial and rational functions later. We will also discuss how to sketch the graphs of trigonometric functions later.
In this post, we use different strategies to graph y = 2x – 1, a linear function. Since the graph of a linear function is a straight line, we only need two points to graph it. Here are four different ways to sketch the graph of linear functions.
1. Any Two Points
Two points determine a line so we can just substitute two values of x. For example, if we let x = 2 and x = 3, we will have two points (2,3) and (4,7).
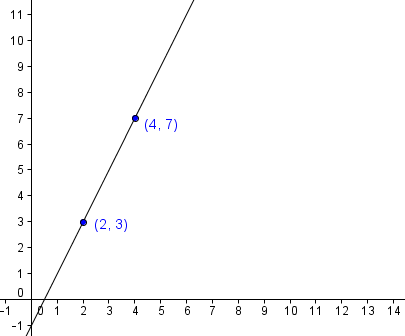
Using the two points, we can now graph the line as shown above.
2. Slope-Intercept
The graph intersects y-axis at y = -1, so we can use it (0,-1) as the first point. For the second point, we use the slope 3 which is equal to 3 (rise over run).
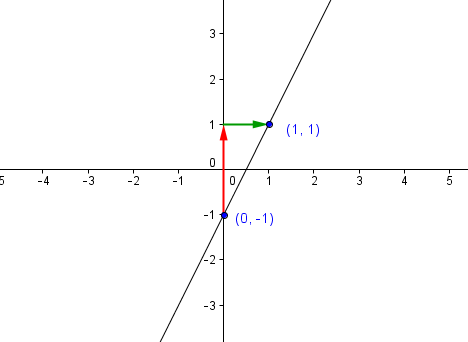
From (0,-1) move 3 units up (rise) and 1 unit right (run) making (1,1) the second point on the graph.
3. Slope Intercept and Translation
Instead of starting at the y-intercept as we have done in number 2, we can start at the origin as first point and use the slope. Move 3 units up and 1 unit to the right giving (1,3) as the second point, then sketch the graph.
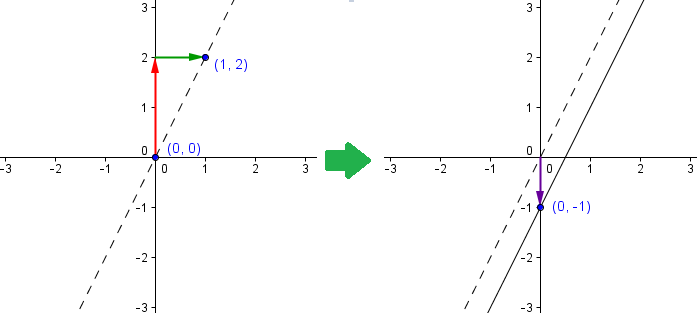
After the graph is drawn, move the graph down (translate) such that it passes through y = -1, the y-intercept.
4. x and y Intercepts
This is probably the easiest way to sketch a linear function. All we have to do is to get the x and y intercepts.
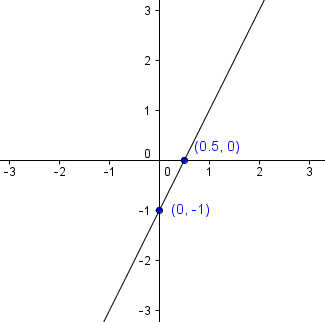
To get the y-intercept, we set x = 0 giving (0,-1) and we set y = 0 to get the x-intercept (0.5,0).
Other methods may be done using the combination of the strategies mentioned above. For instance, we can use the x-intercept and the slope to sketch the graph of the function above.