The Curve Sketching Series

This series discusses the strategies on graphing different functions particularly linear, quadratic, and rational functions.

Curve Sketching 1 is a discussion of the four strategies in graphing linear functions. This includes two points, slope and intercept, translation, and x and y intercepts.

Curve Sketching 2 is a discussion about sketching the graph of quadratic functions. To be able to graph this function you need its critical points such as maximum or minimum, x intercepts, and y-intercept. It is also important to know where the graph opens and the axis of symmetry.

Curve Sketching 3 is a discussion about the vertical and horizontal asymptotes of rational functions. The vertical asymptote of a function is what makes f(x) = n/0 and the horizontal asymptote is the quotient of the leading terms if they have the same power.

asymptote

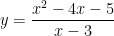
Curve Sketching 4 is a discussion about the oblique asymptote of rational functions. An oblique asymptote exists if the degree of the numerator is 1 more than the degree of the denominator.

Curve Sketching 4: Identifying Oblique Asymptotes

In the previous post in this series, we have learned about asymptotes. horizontal asymptote and vertical asymptote. We continue this series by discussing oblique asymptotes in this post.

An oblique asymptote is an asymptote that is not vertical and not horizontal. We need to know these types of asymptotes to sketch graphs especially rational functions. A rational function contains an oblique asymptote if the degree of its numerator is 1 more than that of its denominator. For instance, the function

y = \displaystyle\frac{x^2-4x-5}{x-3}

has degree 2 in the numerator and 1 in the denominator. If we divide the expression, we have

\displaystyle\frac{x^2 - 4x - 5}{x-3} = x - 1 + \displaystyle\frac{8}{x-3}.

Notice that as x goes to infinity, the remainder goes to 0. The expression x - 1 is the oblique asymptote.

oblique asymptote

The red dashed line in the graph is the oblique asymptote of the function above.  Notice that the function has also a vertical asymptote (see green dashed line) which is x=3.

Note however, that if the degree of the numerator of the rational function is more than the degree of the denominator, but not 1, there are no oblique asymptotes. In addition, there is at most one oblique asymptote or one horizontal asymptote, but not both (Why?).

Reference: Bob Miller’s Calc for the Clueless: Calc I 

Curve Sketching 2: Graphing Quadratic Functions

In the first part of this series, we have learned  4 easy ways to graph linear functions. . In this post, we will learn how to sketch the graph of a quadratic function. Quadratic Functions are functions with equation y = ax^2 + bx +c where a \neq 0. This is the standard form. This equation can also be expressed in the form
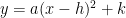
 y = a(x-h)^2 + k where a \neq 0 is the vertex form.

Unlike linear functions, we need more than two points to sketch the graph of quadratic functions. In the following discussion, we will examine the different properties of quadratic functions and use them to sketch their graph.

Here are some of the properties of y = ax^2 + bx + c 
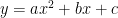
in relation to its graph. For students, it is really important that you think about them — don’t just memorize.

» Read more

1 2