The Curve Sketching Series
This series discusses the strategies on graphing different functions particularly linear, quadratic, and rational functions.
Curve Sketching 1 is a discussion of the four strategies in graphing linear functions. This includes two points, slope and intercept, translation, and x and y intercepts.
Curve Sketching 2 is a discussion about sketching the graph of quadratic functions. To be able to graph this function you need its critical points such as maximum or minimum, x intercepts, and y-intercept. It is also important to know where the graph opens and the axis of symmetry.
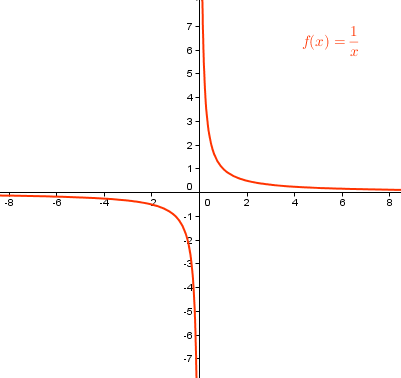
Curve Sketching 3 is a discussion about the vertical and horizontal asymptotes of rational functions. The vertical asymptote of a function is what makes f(x) = n/0 and the horizontal asymptote is the quotient of the leading terms if they have the same power.

Curve Sketching 4 is a discussion about the oblique asymptote of rational functions. An oblique asymptote exists if the degree of the numerator is 1 more than the degree of the denominator.