Curve Sketching 2: Graphing Quadratic Functions
In the first part of this series, we have learned 4 easy ways to graph linear functions. . In this post, we will learn how to sketch the graph of a quadratic function. Quadratic Functions are functions with equation 

Unlike linear functions, we need more than two points to sketch the graph of quadratic functions. In the following discussion, we will examine the different properties of quadratic functions and use them to sketch their graph.
Here are some of the properties of 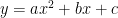
1. Direction of the Graph
If 

2. Vertex
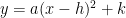
The graph of a quadratic function has a vertex at its minimum (lowest point) if the graph opens upward or at its maximum (highest point) if the graph opens downward. This will give us a rough idea of how the graph will look like if we know the vertex and another point on the graph. In a function with equation in vertex form, the vertex of the parabola is at 
3. Intercepts
The x and y intercepts of Quadratic function are also clues on how the graph looks like. The quadratic function can have at most two x intercepts (see The Geometric Meaning of Discriminant) and exactly one y-intercept.
4. Axis of Symmetry
The axis of symmetry of the quadratic function is a vertical line that passes through its vertex. In standard form is 

Worked Example
Using the properties above, let us sketch the graph of 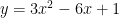
Direction of Graph
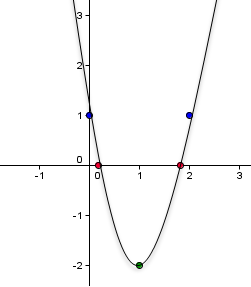
The graph opens upward since 

Vertex
To get the vertex, we convert the equation into the vertex form which gives us 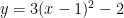

Intercepts
For the y-intercept, we set 


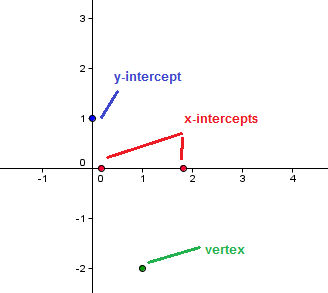
The x-intercepts or the roots can be obtained by setting 


Axis of Symmetry
Since the parabola is symmetric, the axis of symmetry can be used to reflect the point on the y-axis resulting to the fifth point on the graph.

With all the points, it is now possible to sketch the graph as shown below.
At times, the quadratic function can have no x-intercepts making only the vertex and y-intercept as critical points. Of course, additional points on the graph may be obtained by substituting values for x.