Two weeks ago, I discussed the basic concepts of domain and range which I presented in an ‘algebraic way.’ In this post, I would like to discuss these concepts from a graphical perspective.
The domain of a function  is the set of points on the x-axis where if a vertical line is drawn, it will hit a point on the graph. Take for instance, in the linear function
  , we are sure that we can always hit a point wherever we draw a vertical line. In algebraic explanation, we can always find an
  for every . Therefore, we can conclude the that domain of
  is the set of real numbers. On the other hand, if we draw a horizontal line and it hits the graph, then it is part of the range of the graph. Clearly, the range of the is also the set of real numbers.
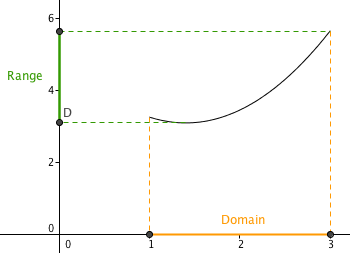
Consider the function in the figure above which we will call  . Notice that when we talk about vertical lines, we can only hit the graph if we draw it between
  and
and  . Since when we draw a vertical line passing through any of these points we hit the graph, we can say that the domain of is the set of real numbers between
  and
and  . The range of is represented by the green line segment on the y-axis. Again, if we draw a vertical line passing any of those points, it will pass the graph. So, the range of is between 3.1 and 5.8 (approximately).
The next graph below which we will call  is just the same as the first figure only that it has a “hole.” The hole there means that the point on the graph does not exist. So, if the x-coordinate of that whole is, for example, 2.5, then we can say that
  is not part of the domain of . Therefore the domain of is the set of all points between 1 and 3 except 2.5. As you would surely guess
  is not part of the range of .
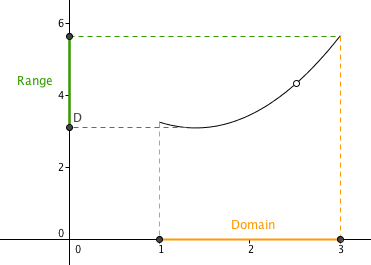
In this post and in the previous, we have learned that the domain of a function is the set for which makes the range defined. In graphical representation, the domain of the function f is the set of x’s where  exist. It means that with in that interval, the graph “above” exist.