Experimental and Theoretical Probability Part 3
This is the third part of the Experimental and Theoretical Probability Series.
In the second part of this series, we have observed in three different experiments that if two dice are rolled, it seems that the probability of getting the sums are not equal. Not only that, we have seen several consistent patterns; for example, 2 and 12 got the least number of rolls; while, 6,7, and 8 got the most.
To investigate this observation, we examine how to get a sum of 2, 12, and 6 first when we roll two dice, and then investigate other sums later. Recall that in the first part of this series, we experimented with two dice, one colored blue and the other red. To distinguish which number belongs to which dice, we color the numbers blue and red to denote blue and red dice.
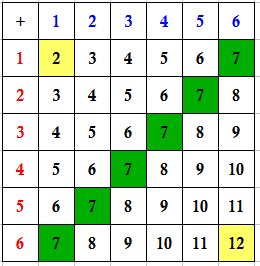
There are only two ways to get a sum of 2; that is, 1 + 1. This is also similar with 12; only 6 + 6. However, we can get a sum of 6 in five ways: 1 + 5, 2 + 4, 3 + 3, 4 + 2, and 5 + 1. In fact, we can create an addition table to get all the possible sums as shown in Figure 1.
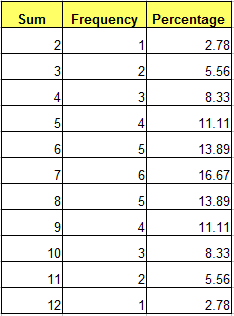
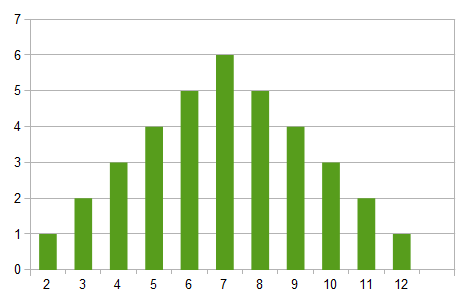
In the table above, there are 36 possible sums, and these sums are not unique. If we tally the sums, we come up with the frequency table in Figure 2 and the graph in Figure 3. As we can see in the frequency table, 7 is the most probable sum( 6 out of 36 or 16.67 percent probability), while 2 and 12 are the least probable sum (only 2.78 percent probability).
In layman’s language, when we say that the probability of rolling a 7 using two dice is 6 out of 36, it means that if we roll a die 36 times, it is likely that we will roll a 7 six times.
Looking at Figure 3, we can see that the bar graph is symmetric; therefore, we can conclude that the probability of rolling a 3 is the same as that of the probability of rolling a 10. Similarly, the probability of rolling a 4 is the same as that of the probability of rolling a 9, and so on.
Our discovery above explains why the results of the previous experiments are such. Of course, if there is more ways to get a sum of seven than to get a sum of two, rolling the dice will likely to have a sum of seven rather than a sum of 2. Also, in the three experiments, we have seen that all the graphs are almost similar to the one shown in Figure 3.

Figure 4 - Result of the second experiment
In the next post, we will discuss why the graphs are similar. We will also explain the relationship between and among our experiment results, and the result of the tally above.


