Experimental and Theoretical Probability 5

This is the fifth and the final part of the Experimental and Theoretical Probability Series.  In this post, we are going to summarize what we have discussed in the previous four posts, and we are going to talk about some  real-life applications of experimental and theoretical probability.
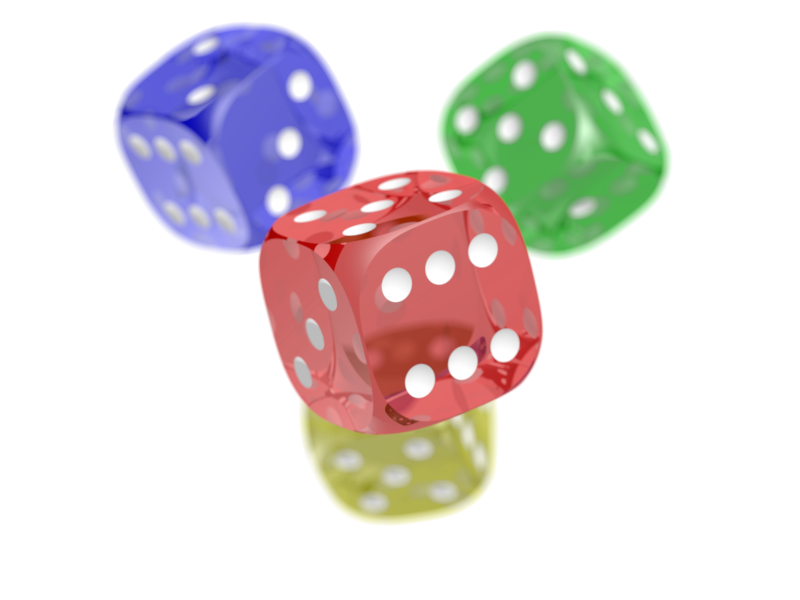
Standard Cubical Dice

Experimental Probability, as we have discussed in the fourth part of this series, may be obtained by conducting experiments and recording the results. It is the ratio of the number of times an  event occurs to the total number of trials. In the first part of this series, we experimented rolling to dice 1000 times (via a spreadsheet) and we tallied the sums.  We recorded the that sum 2 occurred 29 times out of 1000 trials. We can say that the experimental probability of getting a 2 from that particular experiment is 29/1000. » Read more

Experimental and Theoretical Probability Part 4

This is the fourth part of the Experimental and Theoretical Probability Series. Click the following to view the other parts of this series: Part I, Part II, Part III.

***

In the previous posts in this series, we have experimented with dice by rolling two of them and tallying the results.  We have observed some patterns; the sum frequencies are not the same, and we have discovered that it has something to do with the number of ways a sum could be obtained.

On the one hand, we did the three experiments because we wanted which sum would occur most (or least) often. We wanted to get the experimental probability of each sum.

The experimental probability of an event  is the ratio of the number of times the event occurs to the total number of trials. In the second column of the table, we rolled a four (that is, getting a sum of four) 76 times out of  1000 trials; therefore, the experimental probability of rolling a four in that particular experiment was 76/1000 or 7.6%. » Read more

Experimental and Theoretical Probability Part 3

This is the third part of the Experimental and Theoretical Probability Series.

In the second part of this series, we have observed in three different experiments that if two dice are rolled, it seems that the probability of getting the sums are not equal. Not only that, we have seen several consistent patterns; for example, 2 and 12 got the least number of rolls; while, 6,7, and 8 got the most.

To investigate this observation, we examine how to get a sum of 2, 12, and 6 first when we roll two dice, and then investigate other sums later.  Recall that in the first part of this series, we experimented with two dice, one colored blue and the other red.  To distinguish which number belongs to which dice, we color the numbers blue and red to denote blue and red dice. » Read more

1 2