Experimental and Theoretical Probability Part 4
This is the fourth part of the Experimental and Theoretical Probability Series. Click the following to view the other parts of this series: Part I, Part II, Part III.
***
In the previous posts in this series, we have experimented with dice by rolling two of them and tallying the results. We have observed some patterns; the sum frequencies are not the same, and we have discovered that it has something to do with the number of ways a sum could be obtained.
On the one hand, we did the three experiments because we wanted which sum would occur most (or least) often. We wanted to get the experimental probability of each sum.
The experimental probability of an event is the ratio of the number of times the event occurs to the total number of trials. In the second column of the table, we rolled a four (that is, getting a sum of four) 76 times out of 1000 trials; therefore, the experimental probability of rolling a four in that particular experiment was 76/1000 or 7.6%.
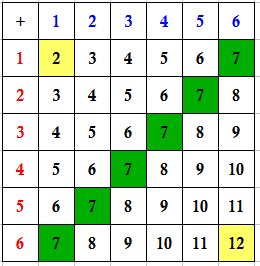
On the other hand, we made the table of all possible sums (see second table) because we wanted to know the theoretical probability of each sum.
The theoretical probability of an event to happen is the ratio of the number of favorable outcomes to the number of all possible outcomes. Hence, the theoretical probability of rolling a four when we roll two dice is 3 (anything that will result to 4: 1 + 3, 2 + 2, and 3 + 1) over 36 (number of all the possible outcomes) as shown in the table; that is 3/36. That means that in theory, if we roll a dice 36 times, we would get a sum of 4 three times. But that is just in theory. In actual experiments, the result could be different.

We can also observe from the first table above that the experimental and theoretical probabilities of a particular sum are close to each other. In rolling a four, for instance, the experimental probabilities are 7.6%, 8.85%, and 7.77% for 1000, 2000, and 3000 trials respectively. The theoretical probability is approximately 8.83%.
Intuitively, it is clear that the as the number of trials increases, the experimental probability is getting more accurate. Take this analogy: If you choose ten people randomly and ask them which operating system they use, and two of them answered Linux, you cannot conclude that 20 percent of the people who have computers are using Linux. However, if you asked more people (randomly of course) you will have more accurate results.
In the next post in this series, we are going to discuss why experimental and theoretical probabilities are important and we are going to learn some of their applications.
