Geometer’s Sketchpad Essentials 5 – Basic Graphing
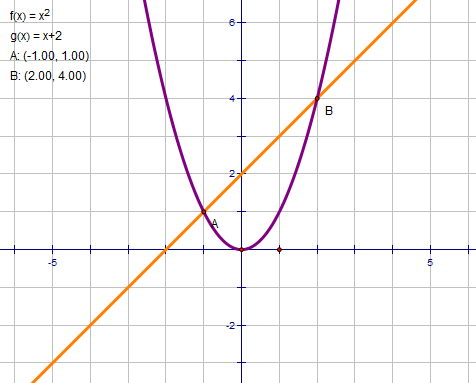
This is the fifth part of the Geometer’s Sketchpad Essentials Series. In this post, we are going to learn how graph using Geometer’s Sketchpad. We are going to plot the function and
, change their properties such as colors, and thickness, and plot their intersections.
The output of our tutorial is shown above. To construct the graph, follow the step by step instructions below.
Instructions
1.) Open Geometer’s Sketchpad.
2.) To display the Cartesian coordinate, click the Graph menu from the menu bar and then select Define Coordinate System.
3.) With the Selection Arrow active, drag the point at (1,0) to adjust space between coordinates of the axes, and drag the axes to adjust their position on the sketchpad.
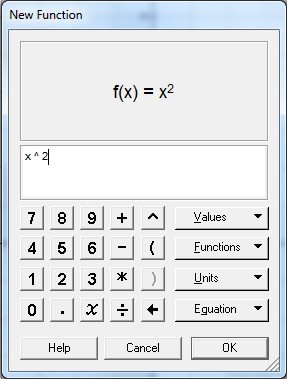
4.) To graph , click Graph, click Plot New Function to display the New Function dialog box.
5.) In the New Function dialog box, type x^2 and then press the OK button. Notice that GSP automatically adds f(x) as shown below, and the equation of the function appears at the upper-left corner of the sketchpad.
6.) To change the thickness of the graph, click the Display menu from the menu bar, choose Line Width, and then click Thick. Change also the color of the line by clicking the Display menu, Color, and then choosing the color you like from the color palette.
7.) Using steps 5-6, plot the graph of . Again, just type
in the New Function dialog box. GSP will automatically name the function
.
8.) Notice that the two graphs intersect at and
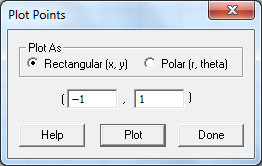
. To plot these points, click Graph, and select Plot Points. Select the Plot as Rectangular(x,y) option in the Plot Points dialog box (see following Figure), type the appropriate x and y values, and click the Plot button.
9.) Plot the second point, then click Done to close the dialog box.
10.) To display the coordinates of the two points, select the two points, click the Measure menu and then click Coordinates.
Now, we have completed our graphs. Save your file and try exploring how to graph other functions.


