Geometer’s Sketchpad Essentials 5 – Basic Graphing
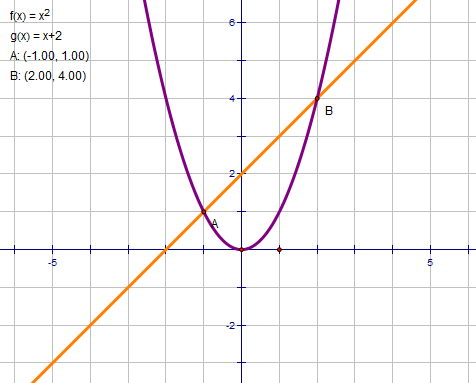
This is the fifth part of the Geometer’s Sketchpad Essentials Series. In this post, we are going to learn how graph using Geometer’s Sketchpad. We are going to plot the function and
, change their properties such as colors, and thickness, and plot their intersections.
The output of our tutorial is shown above. To construct the graph, follow the step by step instructions below. » Read more
