Motion and Graphs: A Calculus Primer
As I have stated in the introduction to Solving Motion Problems, a moving object discussed in elementary and middle schools are usually assumed to be at a constant speed. For example, a car traveling at 65 kilometers per hour is assumed to travel at the said speed the whole time. Of course, this is not what happens in reality. The car speeds up, slows down, or stops at times.
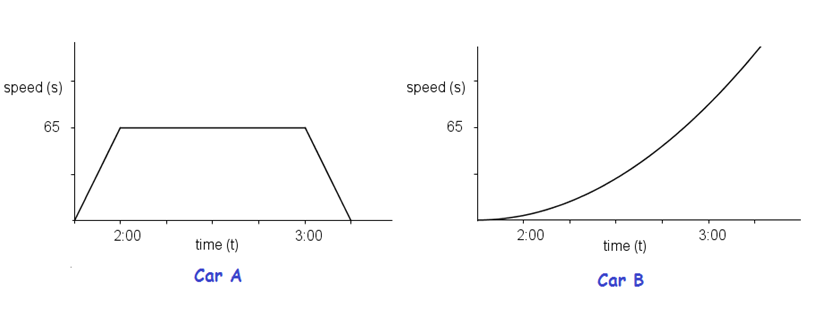
The graphs of two cars traveling at different speeds (kilometers per hour) are shown above. Car A is traveling at a constant speed from 2:00 to 3:00 as shown in the first graph. Since the speed is constant, the graph is a horizontal line. The graph of the accelerating Car B is shown on the right. The car is accelerating, so the graph curves upward as it goes to the right.
Looking at the two graphs, the questions that come to our mind are (1) How far did the two cars travel from 2:00 to 3:00? (2) Which car traveled farther?
The distance is the product of speed and time, so we can easily compute the distance traveled by Car A. The speed of Car A is 65 kilometers per hour and the time is 1 hour, so the distance traveled is
(65 km/hr)(1 hr) = 65 km.
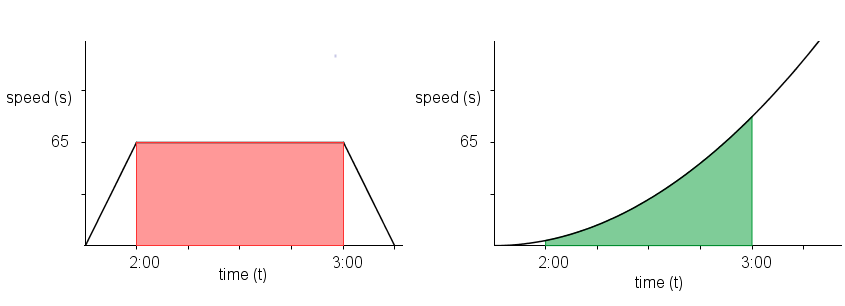
First, we note that the 1 hour in the equation is the difference in time from 2:00 to 3:00. Second, in the graph, the geometric representation of distance, the product of speed and time, is the area of the red rectangle shown below. Consequently, we can conjecture that the distance traveled by Car B is also the area of the green region under the curve. Third, if we can find the area of the green region, we can also answer question 2. However, have no direct way of finding the area of this region. This is the first problem.
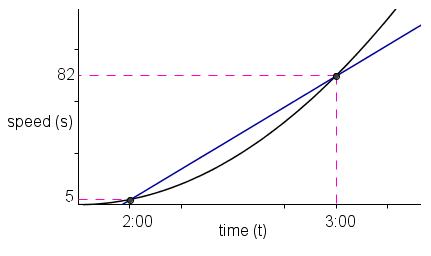
Aside from distance, we might also want to find how much is Car B speeding up or accelerating. The acceleration is the difference in speed over the difference in time. The speed of Car B at 2:00 is 5 kilometers per hour and the speed at 3:00 is 87 kilometers per hour, so, the acceleration is
(82 km/hr – 5km/hr)/1 hr = (77km/hr)/hr.
Again, like the constant speed for an hour, this is not realistic since it is hard to accelerate the car speed for an entire hour. However, let us accept the assumption for discussion purposes.
Notice that the difference in speed over the difference in time of Car B can be interpreted as the slope of the line passing through two points on the graph (see third figure). These points have coordinates (2:00, 5 km/hr) and (3:00, 87km/hr).
We should also be interested in the acceleration of Car B at a particular time, say 2:30. There is no direct way to do this. Remember: The ordered pair ,
is the speed of the car and not its acceleration. From the discussion above, it looks like that we also need to find the slope of some line passing through with
. This is the second problem.
The two problems above are similar to the two problems that gave birth to calculus. In the continuation of this post, we will discuss how mathematicians found clever ways to solve these problems.
To be concluded.


