Understanding Domain and Range Part 2
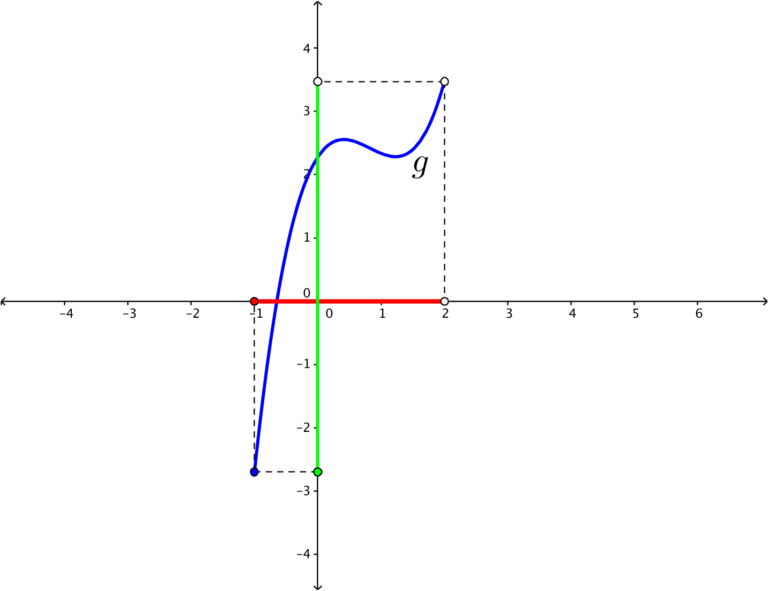
In the previous post, we have learned the graphical representation of domain and range. The domain of the function is the shadow or projection of the graph of
to the x-axis (see the red segment in the figure below). The range of
is the projection of the graph of
to the y-axis (see the green segment in the figure below). In this post, we are going to learn how to analyze equations of functions and determine their domain and range without graphing.

If a graph of a function is projected to the x-axis, the projection is the set of x-coordinates of the graph. A single point on the projection means a point on the graph exists. The existence of a point implies that
exists. This means that the function is defined at
. In effect, the domain of a function is the set of x-coordinates that makes the function defined. In what follows, we learn some examples to illustrate this concept. » Read more