Understanding Domain and Range Part 2
In the previous post, we have learned the graphical representation of domain and range. The domain of the function 
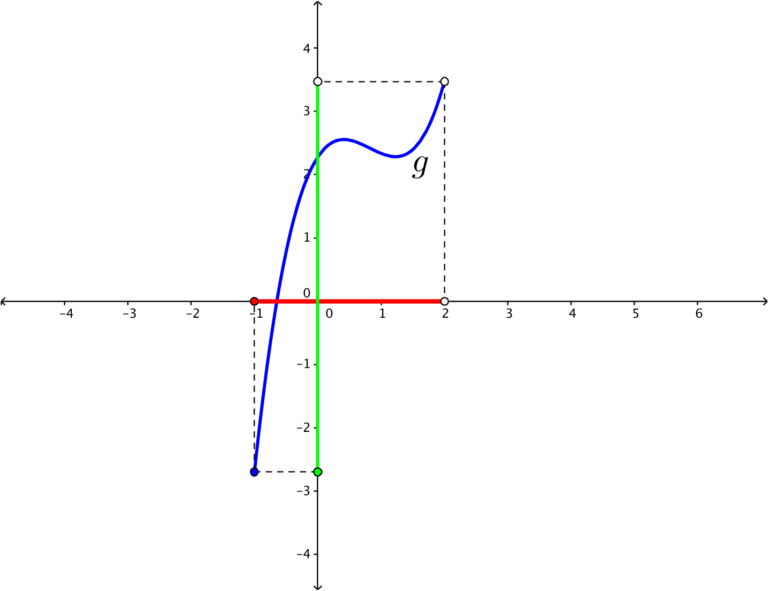
If a graph of a function is projected to the x-axis, the projection is the set of x-coordinates of the graph. A single point 

