Microsoft Mathematics Tutorial 4 – Plotting Graphs
This is the fourth tutorial of the Microsoft Mathematics Tutorial Series.
In this tutorial, we learn how to plot 2 and 3 dimensional Cartesian graphs and 2 dimensional polar graphs. We also learn how to modify the settings of the Graphing window such as plotting range and proportional display.
1. Open Microsoft Mathematics.
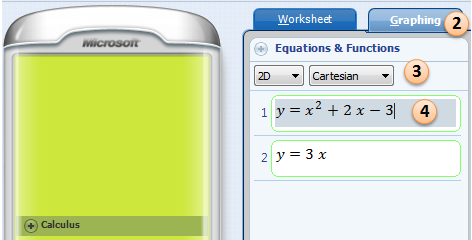
2. Select the Graphing tab.
2. Under Equations and Functions, be sure that 2D and Cartesian are selected.
3. Type 

4. After the equations have been entered, click the Graph button. » Read more