Basic Graphing
You can graph in by typing equations of functions in the Input box.

Figure 1 - The GeoGebra Window
Type the following equations of functions in the Input box and press the ENTER key after each equation.
- y = 2x + 3
- f(x) = -3x + 5
- 2x – 3y + 6 = 0
- g(x) = sin(x)
- y = x^3 – 1
Notes:
- You can type linear equations in the following forms: y = ax + b, f(x) = a(x) + b or ax + by + c = 0.
- The * is used in multiplication and ^ is used in exponentiation. For example you want to graph, y = 2(x – 3)2, then you should enter y = 2*(x-3)^2.
Properties of Graph
You can change the labels, colors, thickness and other properties of graphs (and other objects) in GeoGebra. In this tutorial we are going to change the color, label and thickness of the graph g(x) = sin(x).
To change the properties of the graph g(x) = sin(x), do the following:
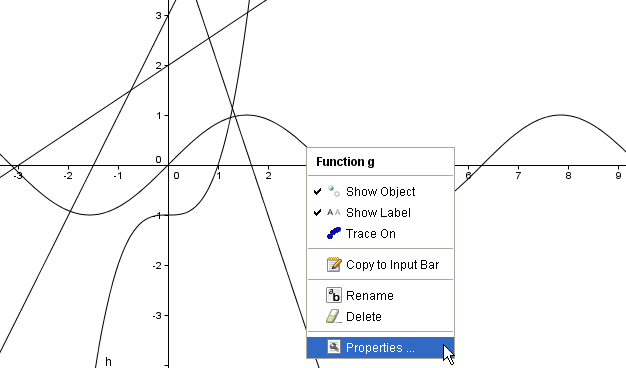
1.) Right click the graph of the sine function then click Object Properties from the context menu.

Figure 2 - The context menu that appears when you right-click a graph
2.) In the Basic tab, be sure that the Show label check box is checked.
3.) Choose Name and Value from the Show label drop-down list box.

Figure 3 - The Basic tab of the Properties dialog box
4.) To change the color, click the Color tab, then choose your color from the Color palette.
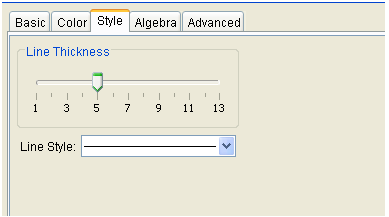
5.) To change the thickness of the graph, click the Style tab, move the slider bar to 5.

Figure 4 - The Style tab of the Properties dialog box.
6.) Click the Close button
Exercise: Change the properties of the other graphs. Explore the options in the Properties dialog box and see their effects to the graphs.
You may also want to view another tutorial on graphs and sliders.
and what is its range? Well, the domain are just the possible values of
that will produce a “valid” value
. To check, we can ask the following questions.
?
?
?
and we can always get a corresponding value for
. » Read more


