This is the fourth tutorial in the GeoGebra Intermediate Tutorial Series. If this is your first time to use GeoGebra, please read the GeoGebra Essentials Series first.
In this tutorial, we use GeoGebra to investigate the effects of parameters of the equations of functions to the appearance of their graphs. First, we type equations  and then use a slider investigate the effects of
  .
.
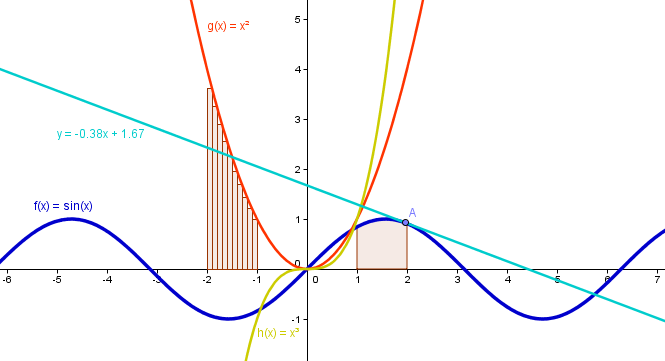
Figure 1 – Sample Graphs created with GeoGebra
Graphing Functions
- Open GeoGebra and be sure the the Algebra and Graphics view is selected for the Perspective menu.
- To graph
 , type y = 2x in the input field. (The input field is the text box with the label Input located at the bottom of your GeoGebra window.) Press the ENTER key on your keyboard.
- Type the following equations: y = 3x, y = 4x , y = -8x, and press the ENTER key after each equation.
- Type more equations of the form where is any real number.
- How does the value of affect the appearance of the graph of the function ?
Using Sliders
To avoid typing over and over again for varying values , we use the slider tool. A slider is a visual representation of a number. This time, we add the parameter b. This means that we will explore the graph of the function of  , where and
 are real numbers.
Instructions
|
1.) Open the GeoGebra and be sure that Algebra View is selected from the Perspective menu. You can also do this by selecting Algebra from the view menu. |
 |
2.) Select the Slider tool and click on the Graphics view to display the Slider dialog box. |
|
3.) In the Slider dialog box, change the slider’s name to m, change the interval to  to to  as shown below. as shown below.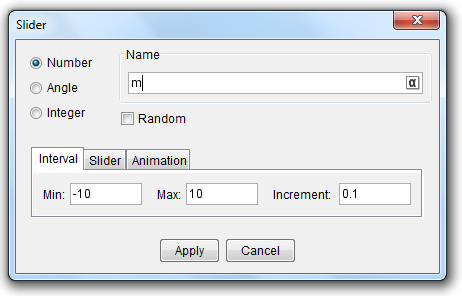 Leave the other values as is and click the Apply button to finish. Leave the other values as is and click the Apply button to finish. |
 |
4.) Adjust the position of your slider if necessary. Move the small black circle on your slider. What do you observe? |
|
5.) To graph the function , type y = mx in the Input box located at the bottom of the window. If the Input bar is not displayed, you can display it using the View menu. |
|
|
6.) Now, Move the small circle on your slider. What do you observe? |
|
|
7.) Now, create a new Slider and name it . Set the interval to and and leave the other values as they are. |
|
8.) To change the function to , double click the graph to display the Redefine window, and then type y = mx + b.
|
|
|
9.) Now, move your slider. What do you observe? |
|
10. ) How does the value of affect the appearance of the graph of the function ? |
|
11.) As an exercise, graph the function  . Explain the effects of the parameters . Explain the effects of the parameters  and to the graph of the function. and to the graph of the function. |
Notes:
- The ^ symbol is used for exponentiation. Hence, we write
 as a*x^2 + c.
- Instead of using
 in writing equations of functions, you can also use
  for the function
  .
.
Last Update: November 12, 2014 for GeoGebra 5.0.