GeoGebra Intermediate Tutorial Series
GeoGebraTutorial 1– Midpoints and Quadrilaterals
In this tutorial, you will use GeoGebra to investigate the properties of the polygon formed by connecting consecutive midpoints of the sides of a quadrilateral. In this construction, you will use the following tools: New Point, Segment between Two Points, Midpoint or Center, and Polygon, Distance tool and Angle tool.
GeoGebra Tutorial 2 – Constructing an Equilateral Triangle
 In this tutorial, we mimic compass and straightedge construction by using radii of two congruent circles to construct an equilateral triangle. The tools that we will use in this tutorial are New Point, Polygon, Circle with Center through Point.
GeoGebraTutorial 3 – Constructing a Square
 This construction is similar to Tutorial 2, mimicking the compass and straightedge construction. In this tutorial, you will use the circle, perpendicular line, and parallel lines tools to construct a square. The tools that you will use in this tutorial are New Point, Circle with Center through Point, Segment between Two Points, Perpendicular Line and Parallel Line.
GeoGebra Tutorial 4 – Graphs and Sliders
 In this tutorial, you will learn how to use the input bar to graph linear functions. We use the GeoGebra slider to show the effects of the values of m and b to the graph of the function y = m x + b.
GeoGebraTutorial 5 – Discovering the Pythorean Theorem
 In this tutorial, you will investigate the relationship among the areas of the squares formed by the three sides of a right triangle. The tool that will be used in this tutorial are Perpendicular Line, Segment between Two Points and Regular Polygon.
GeoGebra Tutorial 6 – Parameterization of Area and Length of a Rectangle
 In this tutorial, you will learn how to write equations, formulas and perform computations in GeoGebra. You will construct a rectangle with a fixed perimeter and a variable length. You will graph the ordered pair (length,area) of a rectangle with a fixed perimeter in the xy-plane and find the dimensions with the maximum area. The tools that will be used in this tutorial are new point,perpendicular line, parallel line, andpolygon.
GeoGebra Tutorial 7 – Sliders, Rotation and the Angle Sum Theorem
 In this tutorial, you will use the slider and the rotation tools to replicate triangles, rotate them and show that the angle sum of a triangle is 180 degrees. The tools that we will use in this tutorial are Line through Two Points, Midpoint or Center, Polygon, Slider, and Rotate Object around Point by Angle.
GeoGebra Tutorial 8 – Tracing Graphs of Trigonometric Functions
 In this tutorial, you will trace paths of points formed by points on the Cartiesian plane. You will graph (d,x) and (d,y) where d is the distance traveled by a point along the circle from (1,0) and x and y are its x and y-coordinates. The tools that you will use in this construction are new point, circle with center through point, and circular arc with center through two points.
GeoGebra Tutorial 9– Vector and Translation
![]() In this tutorial, we will use the vector tool to translate a triangle. We will explore the relationship among the coordinates of the pre-image of an object, the object of its image, and the direction and magnitude of the vector. The tools that we will use in this tutorial are new point,polygon, vector between two points, translate object by vector.
In this tutorial, we will use the vector tool to translate a triangle. We will explore the relationship among the coordinates of the pre-image of an object, the object of its image, and the direction and magnitude of the vector. The tools that we will use in this tutorial are new point,polygon, vector between two points, translate object by vector.
GeoGebraTutorial 10 – Vectors and Tessellation
 In this tutorial, we will use the strategy that we have learned in the Vector and Translation tutorial to tile a plane with regular octagons and squares. The tools that we will use in this tutorial are newpoint,polygon, vector between two points,translate object by vector and regular polygon.
GeoGebra Tutorial 11 – Sliders and Graphs of Trigonometric Functions
 In this tutorial, you will use the slider to investigate the effects of the parameters a, b, c and d in the graph of the sine function f(x) = a sin(bx -c) + d. You will also explore the cosine and tangent functions. You will learn how to use check boxes to show and hide the graphs. The tools that you will use in this tutorial are slider and check box to show/hide objects.
GeoGebra Tutorial 12 – Pictures and Angle Measures
 In this tutorial, we will learn how to insert text and picture in GeoGebra. We will use the protractor image to measure the angle formed by two segments. The tools that we will use in this tutorial are line through two points, segment between two points, angle, and semicircle through two points.
GeoGebra Tutorial 13– How to Use Latex in GeoGebra
 In this tutorial, you will learn how to embed Latex in GeoGebra worksheets. Latex is a typesetting program capable of constructing complicated mathematical formulas. It is widely used by mathematicians in creating scientific documents. It can also be embedded in websites and is integrated in many mathematics programs.
GeoGebra Tutorial 14 – Circle Area Approximation by Inscribed Polygons
 In this tutorial, you are going to inscribe a polygon in a circle, increase its number of sides, and see the relationship between the area of the circle and the area of the polygon as the number of sides increases. This strategy was done by mathematicians in ancient time to approximate the area of a circle.
GeoGebra Tutorial 15 – Tangents, Circles and Circumscribed Polygons
 This tutorial is a continuation of GeoGebra Tutorial 14. In this tutorial, we are going to compare the areas of the circle, its inscribed polygon which we constructed in Tutorial 14 and its circumscribed polygon.
GeoGebra Tutorial 16 – Slider, Sequence and Segment Division
 In this tutorial, we are going to learn how to use the slider control and the sequence command to divide a segment with an arbitrary length into n equal partitions.
GeoGebra Tutorial 17 -Tangent and the Meaning of Derivative
 In this tutorial, we are going to construct point A on a function, and construct a line tangent to the function and passing through A. We are also going to plot a point whose x-coordinate is is the x-coordinate of point Aand the y-coordinate is the slope of the tangent line. We are going to get the derivative of the function and relate it to the path of the second point.
GeoGebra Tutorial 18 – Area Under a Curve and the Riemann Sums
 In this tutorial, we are going to compare the area of a plane under a curve f(x) = x2 bounded by the x-axis and the line x =1 with the sum of the areas of rectangular partitions under the same boundaries.
GeoGebra Tutorial 19 – Introduction to Spreadsheet
 In this tutorial, we are going to use the Record to Spreadsheet tool to record the coordinates of a moving point along the graph of a particular function. We will graph the function f(x) = x2, construct point P with coordinates(a,f(a)) , where a is a value from a slider. We will record the coordinates of the traces of P .
GeoGebra Tutorial 20 –Spreadsheet, Slider and Curves of Best Fit
 In this tutorial, we will use the spreadsheet window to input coordinates of points that will be plotted in the coordinate plane. We will use the Best Fit Line tool to construct a line of best fit of the plotted points. Finally, we will also use the Fitpolycommand and the slider tool to construct polynomial (with varying degrees) curves of best fit.
GeoGebra Tutorial 21 – Spreadsheet and Similarity
 In this tutorial, we will construct a constant number k, in the form of a slider, and see what happens if we multiply the coordinates (x1,y1), (x2,y2) and (x3,y3) of the vertices of our triangle by k. We will investigate if there is a relationship between the original triangle and the triangle formed whose vertices have coordinates (kx1,ky1), (kx2,ky2) and (kx3,ky3).
GeoGebra Tutorial 22 – Spreadsheet, Vectors, and Matrices
 In this tutorial, we are going to explore the relationship between the product of two 2 x 2 matrices. We will set the entries of the factor matrices to integers, and limit the second matrix entries to values of -1, 0, and 1. We will also observe the relationship between their graphical interpretations, known as vectors.
GeoGebra Tutorial 23– Spreadsheet, Bar Chart and Histogram
 In this tutorial, we are going to use the spreadsheet to perform basic data representation. We will plot a frequency table of grouped data and perform basic computations using the spreadsheet window. After the data is completed, we will construct a histogram.
GeoGebra Tutorial 24– Box and Whiskers
GeoGebra Tutorial 25– The Rolling Circle
 In this tutorial, we are going to use GeoGebra in constructing a rolling circle. This way, we would be able to relate the diameter of the circle to its circumference. Moreover, this activity will reinforce the relationship between the angle and radian measure.
GeoGebra Tutorial 26– Constructing a Cycloid
 This tutorial is very similar to the Tutorial 25. In this tutorial, we are going to use GeoGebra to construct a cycloid.A cycloid is the curve defined by the path of a point on the edge of circular wheel as the wheel rolls along a straight line.
GeoGebra Tutorial 27– Animation and Epicycloids
 In this tutorial, we are going to rotate a circle about the center of another circle tangent to it using the animation feature of GeoGebra. Along the rotating circle, we will also rotate a point on its circumference about its center (see red point in the diagram). The path of this point is called the epicycloid.
GeoGebra Tutorial 28– Animation and Hypocycloids

In this tutorial, we are going to construct a hypocycloid using GeoGebra. A hypocycloid is a special curve generated by the trace of a fixed point on a small circle that rolls within a larger circle.
GeoGebra Tutorial 29– Animation, Loci and Radian Measure
 In this tutorial, we are going to introduce the concept of radian. We are going to rotate radius AB’ about point A, the center of the circle. As the point rotates, point C goes back and forth from A to B’at the same speed as that of C. The path of point C traces forms petals.
GeoGebra Tutorial 30 – Loci, Roses and Reflections
 In this tutorial, we are going to reflect a point on a circle about the x -axis and about the y -axis to form rectangle ABCD. We will construct a segment passing through pointB where one of the endpoints on the center and with length equal to the area of a circle. As we move the point B along the the circle, the trace of the end point of the segment (not on the circle’s center) will form a 4-petal rose.
GeoGebra Tutorial 31 – Paper Folding Simulation
 In this tutorial, we are going to use GeoGebra to simulate paper folding. We will represent a rectangular piece of paper with corners ABCD and drag the upper right corner (vertex B) anywhere inside the rectangle. We will use the Point in region tool of GeoGebra 4.0 Beta Release (or New Point tool in 3.2) to construct the figure.
GeoGebra Tutorial 32 – Graphing Piecewise Functions
 In this tutorial, we are going to use thefunctioncommand of GeoGebra to graph piecewise function
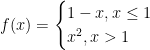
We will manually create the endpoints and the arrows.