GeoGebra Tutorial 23 – Spreadsheet, Barchart and Histogram

Note: Although this is the 23rd of the GeoGebra Tutorial Series, just like other GeoGebra tutorials, it is independent from others.  This means that you can follow this tutorial step-by-step, without needing to learn the previous twenty two tutorials.

In this tutorial, we are going to use the spreadsheet to perform basic data representation.  We will plot a frequency table of  grouped data and perform basic computations using the spreadsheet window.  After the data is completed, we will construct a histogram. » Read more
Using Google Sketchup in Teaching Mathematics

Last March 2010, we have discussed several ways on using Google Sketchup to enhance geometric drawings as well as how to use it in classroom teaching.  In this article, we will discuss more ideas on how to use Google Sketchup in teaching mathematics.

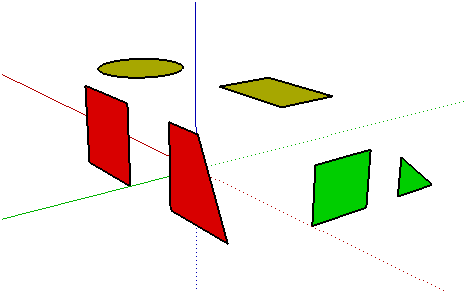
Although Google Sketchup is a drawing software, it can be very helpful to mathematics teachers especially in teaching three dimensional geometry. Using Sketchup, it is  easy to demonstrate what do we mean by coplanar or non-coplanar as shown in Figure 1.

Figure 1

» Read more

The Binomial Expansion

Note: This is the second part of the Binomial Expansion Series

Part I: Milkshakes, Beads, and Pascal’s Triangle

Part II: Binomial Expansion

In the Milkshakes, Beads, and Pascal’s Triangle article, we have shown that the combination of the binary numbers 1 and 0 may be interpreted as the number the flavors of milk shakes, or the number of possible paths of the bead in our Galton board as shown in Table 1. Recall that in the Milkshake problem, Issa was given a choice to combine any number of flavors from four fruits: Apple, Banana, Chico and Durian. Thus, 0101 means banana-durian milkshake. On the other hand, in the beads problem, 0101 is LRLR or the bead went to the left after hitting the peg in row A, right in after hitting the peg in row B, left after hitting the peg in row C and right after hitting the peg in row D. » Read more

1 3 4 5 6