A Calculus Primer Part 2
Introduction
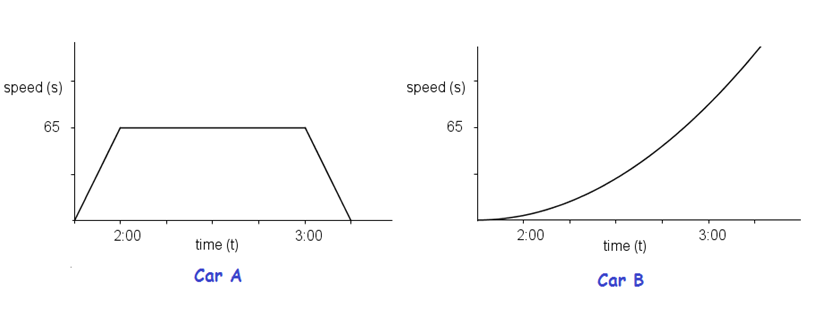
In the first post in this series, we discussed about the graph of the speed over time of two cars, A and B. Car A was traveling at a constant speed from 2 to 3 o’clock, while Car B was traveling the same time but accelerating.

In the discussion, we learned that the distance traveled by the cars is represented by the area under their graphs, while acceleration is represented by slope of the line passing through two points on the graph. We ended our discussion with two questions:
(1) How do we find the distance traveled by Car B?
(2) How do we find the acceleration of the Car B given a particular time?
In this post, we discuss the answer to the first question.
The Problem
As we have mentioned above, finding the distance traveled by Car B is the same as finding the area under the graph from 2 to 3 o’clock and bounded by the horizontal axis. It seems that we have no direct way of doing this. In addition, since the discussion involves the area of a bounded region, particularly, area of the bounded region under the graph (or curve), we can get out of the problem and ask a more general question: How do we find the area under the curve? If we can answer this question, the first question above is also answered.
The Solution
In solving the area problem, we borrow the strategy used by early mathematicians to approximate the area bounded by curves. For instance, to approximate the area of a circle (equivalently to approximate pi), Archimedes inscribed and circumscribed it with polygons. Clearly, as the number of sides of the polygons increases, their areas get closer the to area of the circle.
In the approximation of the area under the curve, we only use rectangles instead of other polygons. We inscribe the area under the graph (or curve) with rectangles. Clearly, to have a more precise approximation, we need to increase the number of rectangles. Consequently, the larger the number the rectangles, the lesser the regions not covered.
There is one problem though. No matter how many rectangles we create, there will still be regions (white space below) that are not covered. This only shows that even if we can approximate the area under the curve, we can never find its real value.

This problem has bothered many mathematicians for hundreds of years before the invention of Analytic Geometry. It eventually become an instrument in the invention Integral Calculus. When Descartes and Fermat invented the Cartesian coordinate system, algebraic methods were developed to deal with the difficulty. The breakthrough came when the concept of limits was made rigorous and formalized.
To be able to solve the problem, we need to understand the concept of limits. That is, as the number of rectangles increases without bound (or as the number of rectangles approaches infinity), the sum of the area of rectangles approaches the area under the curve. This is equivalently saying that the limit of the sum of the areas the rectangles as its number increases without bound is equal to the area under the curve. This is explained in details in Calculating the Area Under the Curve.
So far, we have introduced a real life problem that is similar to the problem that gave birth to Integral calculus. In the next post, we discuss the same problem and see how also it is connected to Differential Calculus.