If you are looking for free software that you can use in teaching as well as solving problems, you may want to check the list below. Most of the descriptions here came from Wikipedia.
Archim – Archim is a freeware program for drawing the graphs of all kinds of functions. It is useful tool for students, teachers and anyone who interest in graphing. User can change many things such color of the graph, grid colors, background, scales and perspective level of the displayed graph.
Axiom (Windows, Linux, Mac)- Axiom is a free general purpose computer algebra system. It consists of an interpreter environment, a compiler and a library, which defines a strongly typed, mathematically (mostly) correct type hierarchy.
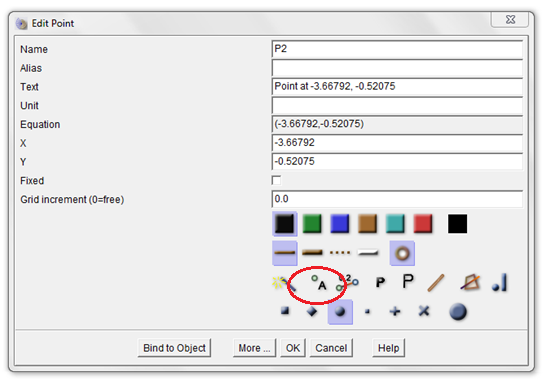
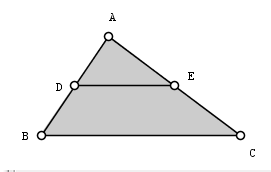
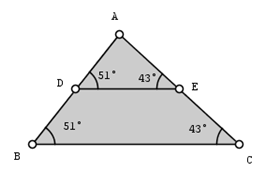
C.A.R. (Windows, GNU/Unix,Mac OS X) – C.a.R. is dynamic geometry program simulating compass and ruler constructions on a computer.
CoCoA– CoCoa (“COmputations in COmmutative Algebra”) is a free computer algebra system to compute with numbers and polynomials.
Euler Math Toolbox is a powerful, versatile, mature software for numerical and symbolic computations written and maintained by R. Grothmannfrom the University of Eichstätt. Euler is similar to Matlab, but has an own style, and a slightly different syntax. Symbolic mathematics is supported in Euler using the open algebra system Maxima.
Geoda – Geoda is a free software package that conducts spatial data, dataanalysis, geovisualization, spatial autocorrelation and spatial modeling.
Freemat (Windows, Linux, Mac OS X)- FreeMat is free math software that is more advance and designed for engineering and scientific prototyping and data processing.
GeoGebra (Windows, GNU/Unix, Mac OS X)- GeoGebra is free math software for schools that joins geometry, algebra and calculus. User can free to copy, distribute and transmit GeoGebra for non-commercial purposes. The software is available for multiplatform include Windows, Linux and Mac. Among many other free mathematics software packages, GeoGebra is good that you can have a try.
Geonext (Windows, GNU/Unix,Mac OS X) – GEONEXT is dynamic mathematics software that provided for free of charge as learning and teaching tool. This free math software is also available for three main operating systems for Windows, Linux and Macintosh user. The software can be used for learning, teaching from elementary school up to calculus at high schools. GEONEXT is also good for user to try.
GnuPlot – (Mac, GNU/Linux) Gnuplot is a portable command-line driven interactive data and function plotting. The software is copyright, but user can freely distributed. User can plot both in 2D and 3
Graph (Windows)– Graph is an open source application used to draw mathematical graphs in a coordinate system. Anyone who wants to draw graphs of functions will find this program useful. The program makes it very easy to visualize a function and paste it into another program. It is also possible to do some mathematical calculations on the functions.
GraphCalc (Windows , GNU/Linux) – A free, open source 2D/3D graphing application.
Graph Calculator 3D – is an easy-to-use tool that plots 2D and 3D functions. Plots regular and parametric equations, coordinates and tables, Cartesian/Polar coordinates in 2D, Cartesian/Cylindrical/Spherical coordinates in 3D, inequalities in 2D and 3D. It has also an animation and variable slider in 2D and 3D. It is capable of importing coordinates from excel and csv files. It is commercial, but it has a free version.
Mathomatic – Mathomatic is a free, portable, general-purpose computer algebra system (CAS) that cansymbolically solve, simplify, combine, and compare algebraic equations, perform complex numberand polynomialarithmetic, etc.
Mathrax (Mac, Windows) – MathTrax is a graphing tool for middle school and high school students to graph equations, physics simulations or plot data files. The graphs have descriptions and sound so you can hear and read about the graph. Blind and low vision users can access visual math data and graph or experiment with equations and datasets
Maxima (Windows, Linux, Mac)– Maxima is a symbolic-based mathematics software providing an number of functions for algebraic manipulations, calculus operations, matrix and linear algebra and other mathematical calculations.
Microsoft Mathematics – Microsoft Mathematics (formerly Microsoft Math) is an educational program, designed for Microsoft Windows, that allows users to solve math and science problems. Developed and maintained by Microsoft, it is primarily targeted for students as a learning tool.
NonEuclid – NonEuclid is an interactive Java software for creating ruler and compass constructions in both the Poincaré Disk and the upper half-plane models of Hyperbolic Geometry.
Octave – GNU Octave is a high-level language, primarily intended for numerical computations. It provides a convenient command line interface for solving linear and nonlinear problems numerically, and for performing other numerical experiments using a language that is mostly compatible with Matlab. It may also be used as a batch-oriented language.
PARI-GP (Windows, Linux, Mac) – The PARI/GP system is a package that is capable of doing formal computations on recursive types at high speed. It is primarily aimed at number theorists. Its three main strengths of the system are its speed, the possibility of directly using data types that are familiar tomathematicians, and its extensive algebraic number theory module.
PSPP – PSPP is a free software application for analysis of sampled data. It has a graphical user interface and conventional command line interface. It is written in C, uses GNU Scientific Library for its mathematical routines, and plot utils for generating graphs.
Qalculate – Qualculate is a multi-purpose desktop calculator for GNU/Linux. It is small and simple to use but with much power and versatility underneath. Features include customizable functions, units, arbitrary precision, plotting, and user-friendly interface (KDE or GTK+).
Reduce – REDUCE is an interactive system for general algebraic computations of interest to mathematicians, scientists and engineers.
SAGE – SAGE is open source math software which is provided for free of charge and available for Windows, Linux and Macintosh platform. Use can use for studying many things about mathematics, including algebra, calculus, elementary to very advanced number theory, numerical computation, commutative algebra, group theory, graph theory, exact linear algebra and more.
Scilab – Scilab is a scientific software package for numerical computations providing a powerful open computing environment for engineering and scientific applications.
Scipy – SciPy (pronounced “Sigh Pie”) is open-source software for mathematics, science, and engineering. It is also the name of a very popular conference on scientific programming with Python. The SciPy library depends on NumPy, which provides convenient and fast N-dimensional array manipulation. The SciPy library is built to work with NumPy arrays, and provides many user-friendly and efficient numerical routines such as routines for numerical integration and optimization. Together, they run on all popular operating systems, are quick to install, and are free of charge. NumPy and SciPy are easy to use, but powerful enough to be depended upon by some of the world’s leading scientists and engineers
SymPy(Windows, Linux, Mac) – Sympy is a Python library for symbolic mathematics. It aims to become a full-featured computer algebra system(CAS) while keeping the code as simple as possible in order to be comprehensible and easily extensible. SymPy is written entirely in Python and does not require any external libraries, except optionally for plotting support.
Wingeom (Windows) – Wingeom is for high-precision geometric constructions in both two and three dimensions. Drawings can be highlighted and animated in a variety of ways
Winmat (Windows) – Winmat allows the user to calculate and edit matrices, and solve standard linear algebra problems. The program operates in real, complex, and integer mode.
Winplot (Windows) – Winplot is a general-purpose plotting utility, which can draw (and animate) curves and surfaces presented in a variety of formats.
WinStat (Windows) – Winstats provides access to scatter plots, curve fitting, histograms, statistical data, and standard theoretical probability distributions. It performs many statistical tests and calculates confidence intervals. It simulates dealing cards, rolling dice, sampling candy, taking random walks, and tossing darts, needles and coins. There are two least-squares demos and a confidence-interval demo.
Wiris – WIRIS CAS is an on-line platform for mathematical calculations designed for education. It is a CAS (Computer Algebra System) that also includes a DGS (Dynamic Geometry System) inside. You can access a powerful calculation toolbar through an HTML page that includes integrals and limits calculation, function graphing in 2D or 3D and symbolic matrices manipulation. It covers all mathematical topics from primary school to University level (Calculus, Algebra…).
Xcas – Xcas is a user interface to Giac, a free, basic computer algebra systemfor Windows, Mac OS X and Linux/Unix. Giac can be used directly inside other C++ programs.
YACAS – YACAS is a general purpose computer algebra system, a program for symbolic manipulation of mathematical expressions. It uses its own programming languagedesigned for symbolic as well as arbitrary-precision numerical computations.
I will update this post by adding additional software from time to time so you can bookmark it in your browser. Keep posted.


