Maxima Tutorial 2: Algebraic Manipulation and Graphing

In Maxima Tutorial 1, we have discussed how Maxima can be used to perform numerical computations.  In this tutorial, we are going to enumerate some of the capabilities of Maxima to perform symbol manipulation.  Note than in each equation below, do not forget to press the ENTER key after the semicolon.

Maxima can perform algebraic operations and here are a few of its capabilities:

  • Assigning values to variables and using them in computations.
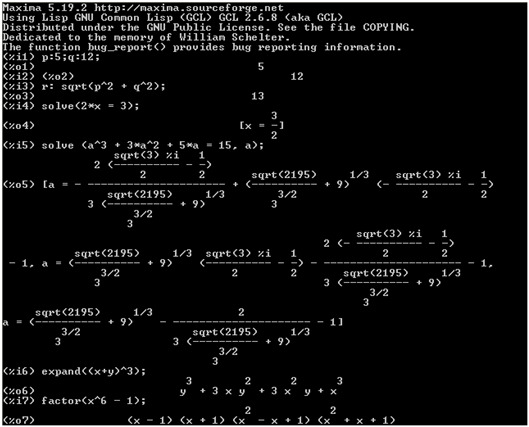
  1. p:5; q:12; (Press the Enter key on your keyboard after the second semicolon)
  2. r: sqrt(p^2 + q^2);

In a, we used the colon sign to assign values to p and q and assign them as the value of r in b.

  • Solve equations in one variable
  1. solve(2*x  = 3, x);
  2. solve(a^3 + 3*a^2 + 5*a = 15,a);
  3. ratsimp(2*a + 3*b + c – a –b +2*c);
  4. ratsimp(x^2 – 3*x*y + y^2 – 2*x^2 – 5*y^2);

In c, we solve for the 2x = 3 for the value of x. In d, we use * for multiplication, and ^ for exponentiation. The ratsimp command simplifies expressions.

  • Expand and factor algebraic expressions
  1. expand((x + y)^6);
  2. factor (x^6 – 1);

Figure 1 – The Maxima command line.

  • Solve systems of linear equations
  1. linsolve ([3*x + 4*y = 7, 2*x + a*y = 13], [x, y]);
  2. eq_1: x^2 + 3*x*y + y^2 = 0;
  3. eq_2: 3*x + y = 1;
  4. solve (eq_1,eq_2);

In a, we solved for the values of x and y in the systems of linear equation 3x + 4y = 7 and 2x + ay = 3. In b and we defined two equations, eq_1 and eq_2, then used the two variables in d.

  • Plot graphs in 2 and 3 dimensions
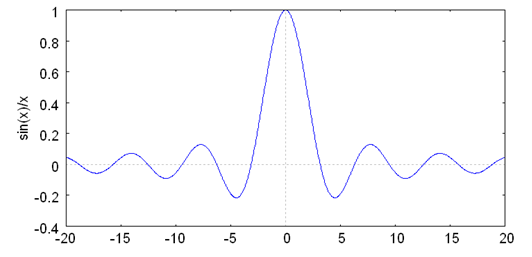
  1. plot2d (sin(x)/x, [x, -20, 20]); (See Figure 1)
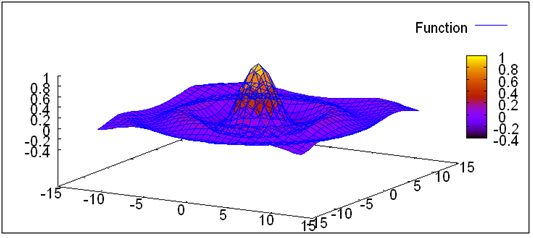
  2. plot3d(sin(sqrt(x^2 + y^2))/sqrt(x^2 + y^2), [x,-12, 12], [y,-12,12] (See Figure 2)

Figure 2 – Graph of sin(x)/x.

Figure 3 – Graph of (sin(sqrt(x^2 + y^2))/sqrt(x^2 + y^2).

Geometer’s Sketchpad Tutorial 1: Constructing an Equilateral Triangle

In this tutorial, we will use the Geometer’s Sketchpad to mimic the compass and straightedge construction tool we use in elementary geometry.  Geometer’s Sketchpad is a proprietary interactive geometry software developed by Key Curriculum Press.

The idea in constructing an equilateral triangle is to use the centers of two circles and one of their intersections as vertices of the triangle (see Figure 6). First, we construct a circle with center A passing through B, then construct a circle with center B and passing through point A, and then determine their intersections. Next, we hide all the unnecessary objects and connect the three points with segments. The final output of the tutorial is shown in Figure 1.
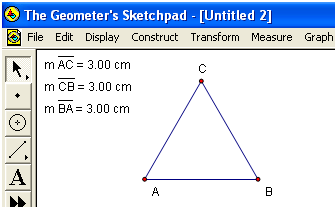
 

Figure 1 – The appearance of the expected of this tutorial.


In constructing our triangle, we will learn the following:

  • select, deselect and move objects
  • construct objects such as circles and  segments
  • display the label of objects
  • hide objects
  • display the measure of segments
  • construct points of intersection of two objects

Construction Steps

1.)  Click the circle tool, determine the center by clicking a location on the drawing pad, move the mouse to determine the radius, and click another location to draw the circle. If you made a mistake, just click the Edit menu and choose Undo from the list.


Figure 2 – The toolbar contains the different tools of Sketchpad used for drawing.


2.) Click the arrow selection tool and try to drag the two points. What do you observe?

3.) We now show the label of the two points. Click the two points, then click the Display menu from the menu bar, then click Show labels from the drop-down menu. Notice that Geometer’s Sketchpad names the objects in alphabetical order, the center of the circle is named A and the point on the circle is named B.
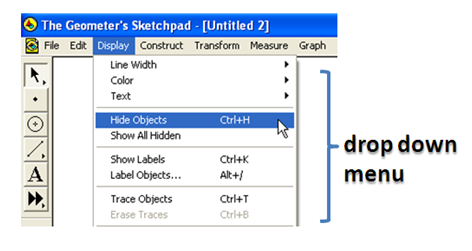
 

Figure 3 – The Display drop-down menu.


4.) To construct a circle with center point B and passing through A, click the compass tool, click point B and click point A. Your drawing should look like the one shown in Figure 4.
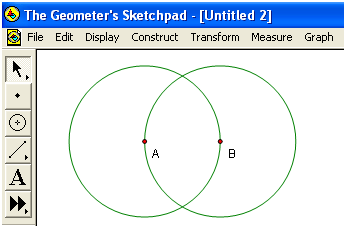
 

Figure 4 – Circe with center A and passing through B and circle with center B passing through A.


5.) Next, we construct the intersections of two circles. Click the selection arrow tool, click then select the two circles. (Be sure that only the two circles are selected. To deselect an object, click anywhere on the drawing pad).


Figure 5 – The two circles are selected.


6.) To construct the intersection, click Construct from the menu bar, then Intersections from the drop-down menu bar.

7.) Display the name of the two intersections by clicking both of them and clicking Show labels from the Display menu.

8.) Next, we hide the two circles and point D leaving only points A, B and C on the drawing area. To do this click the selection arrow tool, click the two circles and point D.
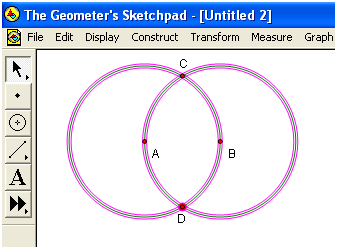
 

Figure 6 – The two circles and point D are selected.


9.) To hide the selected objects, click the Display menu and choose Hide Objects. Notice that the only left objects on the drawing area are points A, B and C.

10.) Select segment tool (be sure that you choose the segment tool, not the ray tool or line tool) from the straightedge tool, then connect the three points to form triangle ABC. Using the selection arrow tool, move the points on the vertices of the triangle.

  • What do you observe?
  • What kind of triangle is triangle ABC? Why do you say so?

11.) Let us try to see if your conjecture about triangle ABC is true. We will display the length of the segments. To do this, select one of the sides of the triangle, click Measure from the menu bar and choose Length from the drop-down menu.

  • Measure the other two sides. What do you observe?
  • Move the vertices of the triangle. Is your observation still true?
  • Explain why triangle ABC is always an equilateral triangle.

12.) If you want to save your file, click the File menu from the menu bar and click Save from the drop-down menu.

13.) Type the file name of your first sketch, choose a location to save, then click Save.

I also created a similar tutorial on creating an equilateral triangle but using GeoGebra. If you are interested, click here.

Congratulations, you just finished your first construction. Click here to go to Geometer’s Sketchpad Tutorial 2.


GeoGebra Tutorial 13 – How to use Latex in GeoGebra

This is the 13th GeoGebra Tutorial in the GeoGebra Tutorial Series and in this post, we learn how to use Latex in GeoGebra. If this is your first time to use GeoGebra, you might want to read the GeoGebra Essentials Series first.

In my previous posts, we have discussed how to use Latex in writing mathematical equations in blogs and websites,  and we also have learned the most commonly used Latex commands.

For those who are new to  Latex, it is a typesetting program capable of generating mathematical expressions which can be embedded in blogs, forums and websites.  For example, the quadratic formula below is written using Latex code

x = \displaystyle\frac{-b \pm \sqrt{b^2-4ac}}{2a}.

Fortunately, many mathematics software nowadays are compatible with Latex typesetting. In this tutorial, we learn how to use Latex in GeoGebra.  If you already know how to code Latex, then this will be very easy for you. However, if this is your first time to use Latex, you may want to read an introduction about it.

In GeoGebra, we can only code Latex using the Insert Text tool. For example, we write the of the famous Pythagorean theorem equation c2 = a2 + b2, we need to use Latex code because GeoGebra is not capable of creating superscripts, except for equations or expressions placed in the Input bar. If we will not use Latex, our equation will appear like c2 = a2 + b2 or we can use c^2 = a^2 + b^2.  But suppose the  equation that we type is more complicated – such as the quadratic formula – it is impossible for us to write it without confusing the reader.

Follow the instructions below on how to use the Insert Text tool to generate Latex code. If you want to follow the tutorial step-by-step while reading, you can open the GeoGebra window here.

Instructions

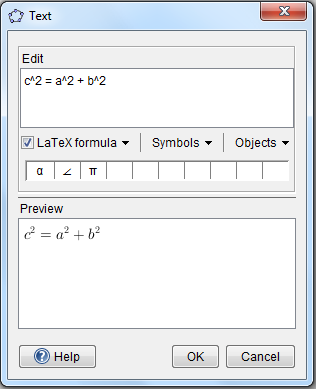
1.)    To use the text tool, select the Insert Text tool and click the part of the Graphics view where you want to place the text.  This will display the Text dialog box.

2.)    In the Text dialog box, type the code c^2 = a^2 + b^2 in the Edit box and then be sure that the Latex formula check box is checked. The ^ is the code used for exponentiation. The Preview window shows how your text will be displayed.

3.)    Press the OK button when finished. Your text should look like the one shown in Figure 3.

To combine text and mathematical expressions coded in Latex, we have to separate the text and the mathematical formula. To do this, we have to enclose the mathematical expression with dollar signs. For example, if we want to write

The hypotenuse of a right triangle with sides a and b is equal to \sqrt{a^2 + b^2}

we have to type

The hypotenuse of a right triangle with sides $a$ and $b$ is equal to $\sqrt{a^2 + b^2}$

The GeoGebra output of the code written above is shown below.

Shown below are some of the most common symbols that are used in GeoGebra.

LaTeX input Result
a \cdot b a \cdot b
\frac{a}{b} \frac{a}{b}
\sqrt{x} \sqrt{x}
\sqrt[n]{x} \sqrt[n]{x}
\vec{v} \vec{v}
\overline{AB} \overline{AB}
x^{2} x^2
a_{1} a_{1}
\sin\alpha + \cos\beta \sin \alpha + \cos \beta
\int_{a}^{b} x dx \int_{a}^{b}xdx
\sum_{i=1}^{n} i^2 \sum_{i=1}^{n}i^2

If you want to practice other latex command download the list of latex symbols or comprehensive list of latex symbols.

1 2 3 4 5 6 12