Drawing Stunning Math Diagrams using PowerPoint Part I

Many of my readers emailed and requested me to write a tutorial on drawing  beautiful geometric diagrams such as shown in Figure 1, so I will include it in my tutorials.  Most diagrams in this blog are made using GeoGebra and Windows Microsoft PowerPoint. The tessellations shown in Figure 1 that we are going to create today was made using Windows MS PowerPoint 2007.  It was taken from my post Tessellation: The Mathematics of Tiling.

In this tutorial, we are going to create blue hexagonal tessellation, shown in Figure 7, and  I will leave to you the square and triangular tessellations as an exercise.
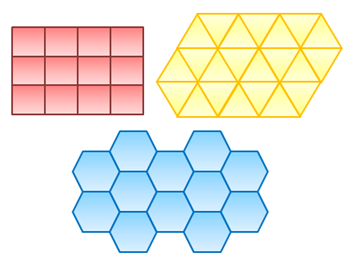
Figure 1 – Regular polygons that can tile the plane.

Step-by-Step Instructions

1. Open Microsoft PowerPoint. Your window should look like the one shown in Figure 1.

Figure 2 – The PowerPoint 2007 Window

2. Delete the two text boxes (the one with the Click to Add title and, Click to Add subtitle) by clicking them and pressing the Delete key on your keyboard.

3.  To create a regular hexagon, click the Insert menu, click the Shapes icon, and then drag the cursor on the slide while holding the SHIFT key on your keyboard. The shift key is used in constructing regular polygons. Try not holding the SHIFT key and drag.

Figure 3 – The Shape palette window.

4. To change the color of the hexagon select it and click the Format menu should appear at the rightmost part of the menu bar.

5. In the Format menu, click the Shape Fill drop-down button and choose Light blue from the color palette (or you can choose any color you want.)
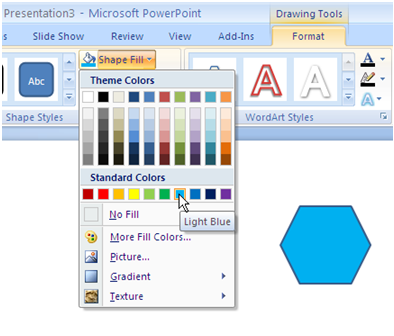
Figure 4 – The Shape Fill Color Palette.

6. Again, click the Shape Fill drop-down button, click the Gradient option and choose the gradient style you want.
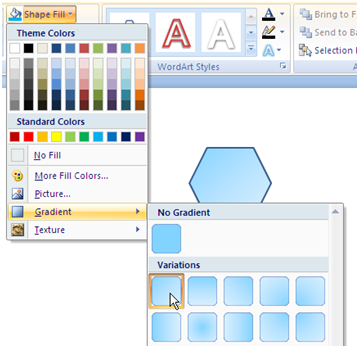
Figure 5 – The Gradient Palette

7. Next, we will thicken the border line. To do this, click the Shape Outline drop down button (below the Shape Fill), select Weight then select 3. Your drawing should look like the Figure below.

Figure 6 - The formatted regular hexagon.

8. To duplicate the hexagon you just created, select it, press CTRL-C to copy (that is, hold the CTRL key on your keyboard, the press C), then press CTRL-V six times.

9. Use the mouse or ARROW keys on your keyboard to tessellate. Your final output should look like the figure below.

Figure 7 - Final Output

10. As an exercise, tessellate different shapes (square or equilateral triangle), and use different colors and gradient styles. Copy the other two tessellations shown in Figure 1.
Slope Concept 3 – Slopes of Vertical and Horizontal Lines

Note: This is the third part of the Slope Concept Series.

Part I: Basic Understanding of Slope

Part II:  Slope of the Graph of a Linear Function

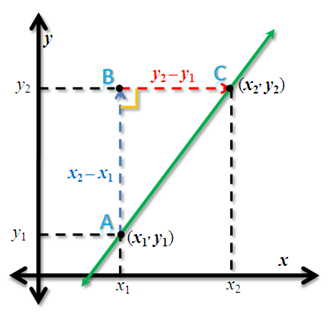
In the Understanding the Basic Concepts of Slope post, we have discussed that the slope of a line in the coordinate plane is described as the change in y over the change in x. When we say change in x, or change in y, we talk about the ‘change distance.’ To determine a distance we need two points.  If we are in the coordinate plane, and we have two points with coordinates (x_1,y_1) and (x_2,y_2), then the rise is y_2 - y_1 and the run is x_2 - x_1. Thus, the slope of the line containing the two points is \displaystyle\frac{y_2-y_1}{x_2-x_1}.

Fiigure 1 - Slope of a line containing points with coordinates (x1,y1) and (x2,y2).

We also have discussed that the slope of a horizontal line is 0 by rotation. Here, we will show the same fact using coordinates as shown.

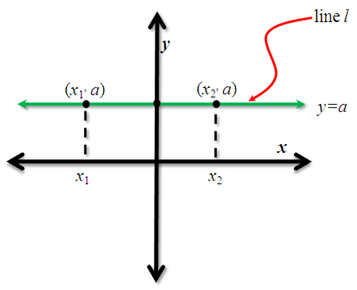
A horizontal line has the same y-coordinates everywhere. Let us consider line l in Figure 2 with equation y = a.   Let us pick two points with coordinates (x_1,a) and (x_2,a). Using the formula above, calculating for the slope we have \displaystyle\frac{a -a}{x_2 - x_1} = \frac{0}{x_2 - x_1 }= 0. Hence, the slope of a horizontal line l is 0.

Figure 2 - A horizontal line containing points with coordinates (x_1,a) and (x_2,a)..

Similarly, a vertical line has the same x-coordinate everywhere. Let us consider line m in Figure 3 with equation x = b.   Let us pick two points with coordinates (b,y_1) and (b,y_2). Using the formula above, calculating the slope, we have \displaystyle\frac{y_2 - y_1}{b - b} = \frac{ y_2 - y_1}{0} which is undefined.

Figure 3 - A horizontal line containing points with coordinates (b,y2) and (b,y1).

In the sequel of this post, we will discuss the lines with positive and negative slopes.

The Square Root of Three

The Square Root of Three is a poem I have heard several about two years ago from the movie Harold and Kumar . Enjoy reading it.

The Square Root of Three

David Feinberg

I’m sure that I will always be
A lonely number like root three

The three is all that’s good and right,
Why must my three keep out of sight
Beneath the vicious square root sign,
I wish instead I were a nine

For nine could thwart this evil trick,
with just some quick arithmetic

I know I’ll never see the sun, as 1.7321
Such is my reality, a sad irrationality

When hark! What is this I see,
Another square root of a three

As quietly co-waltzing by,
Together now we multiply
To form a number we prefer,
Rejoicing as an integer

We break free from our mortal bonds
With the wave of magic wands

Our square root signs become unglued
Your love for me has been renewed


http://math.bizbox.ca/wp-content/uploads/2009/04/math_poem.jpg

math_poem.jpg (JPEG Image, 589×319 pixels) via kwout

1 2 3 4 6