Rational and Irrational Numbers

The need of men to perform certain mathematical operations led to the birth of different types of numbers. People in the ancient times used only counting numbers to keep track of the number of their belongings such as animals.  The concept of trade led to the invention of 0 and negative numbers. The need to divide led to the invention of rational numbers.

In this article, we are going to take a look at the characteristics of rational and irrational numbers.

Rational numbers are numbers of the form a/b where ab are integers, and b not equal to zero. Rational numbers are called rational not because they are reasonable, but because they are a ratio of two integers.  It is worthy to note the conditions in the definition. That is because not all fractions are rational numbers. For example, \frac{2 \pi}{3 \pi} is a fraction, but it is only a rational number when simplified. From the definition, we can deduce that all integers are rational numbers since {…,-3, -2, -1, 0, 1, 2, 3,…} = {…, -3/1, -2/1, -1/1, 0/1, 2/1, 3/1, …}.

Geometric Interpretation of Rational and Irrational Numbers

In ancient times the Greeks, particularly the Pythagoreans, believed that all quantities are rational; that is, all quantities can be expressed as a ratio of two integers. Geometrically, this can be interpreted as follows. Given any two lengths, a unit length can be found that can measure the two lengths exactly without gaps or overlaps. In the example in Figure 1, we have two segments a and b, and we found a unit length that would fit exactly a whole number of times in both segments. The ratio of a:b is 7:6, or we can express it in a fraction that a is 7/6th of b.
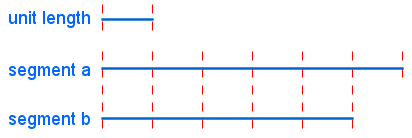
Figure 1 – The division of segments a and b into unit lengths.

This belief, as most of us now know, was proven to be false. The Pythagoreans later discovered that given a square with length 1 unit, no unit length, however short, can be found to measure both the side of the square and its diagonal like what we have done above. They have concluded that the length of the diagonal cannot be expressed as the ratio of two integers and hence not rational.  Today, numbers that are not rational are called irrational numbers. Hence, we define irrational numbers as numbers that cannot be expressed as a ratio of two integers.

Figure 2 – The square with length 1 unit has irrational diagonal.

Using the Pythagorean Theorem, we now know that the length of the diagonal of a square with side length 1 unit is equal to \sqrt{2}. We have already discussed and proved that \sqrt{2} is irrational.

The collection of all rational and irrational numbers is called real numbers. Geometrically, real numbers are represented by the real line as shown in Figure 3.

Figure 3 – The real number line.

Each real number can be represented by a point on the real number line and every point on the number line has a corresponding real number.

Another Representation of Rational and Irrational Numbers

Aside from fractions, we can also represent rational numbers with decimals.  For example, 1/5 = 0.2  and 1/3 = 0.333….  Observe that 0.2 has a finite number of decimals while 0.333… has infinite.  Irrational numbers can also be represented using decimals.  They are the types of decimals that do not end and do not repeat.

Several irrational numbers are very popular, and we had been using them from elementary school to college. The irrational numbers \pi, e and \phi are several of irrational numbers that we are acquainted with.
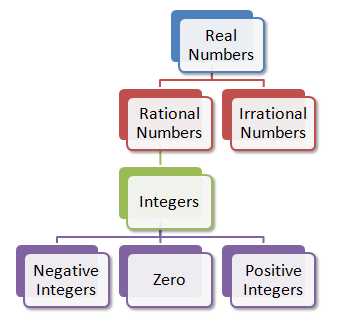
Figure 4 – The structure of the real number system.

From our discussion above, we can see that real numbers are divided into two main subsets – rational and irrational numbers.
Arithmetic Sequences and Linear Functions

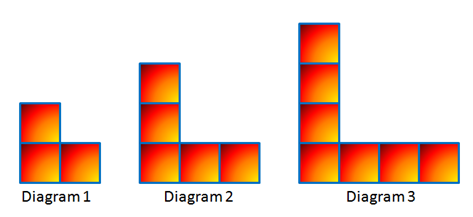
Problem: Consider the diagrams below.  If the pattern continues, how many squares will there be in Diagram 50? Diagram 100?

Figure 1 - A sequence of L-shaped square blocks.

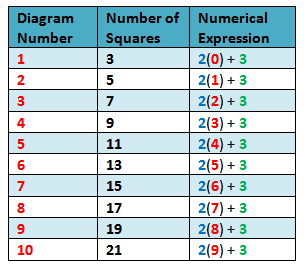
In solving problems, it is important to present data in which we can easily see patterns. Table 1 shows the relationship between the diagram numbers and the number of squares.

Table 1 – The relationship between the diagram number and the number of squares.

We can solve this problem by “brute force” extending the table up to Figure 100, but that is not very “mathematical.” What mathematics had taught us is to find patterns, and, if possible, make generalizations. Using the first term, the constant difference and the diagram number, we can form a numerical expression that when simplified will result to the number of squares as shown in Table 2. Looking at the table, we can see that the first term is 3, and the difference is 2.  Using this pattern, it is now easy to compute the number of squares of any diagram number.

Examine the table and see if you can find the pattern before proceeding.

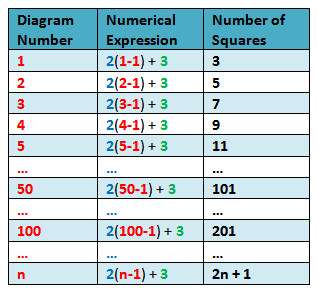
Table 2 - Numerical expressions describing the number of squares in each diagram number.

In Table 2, we can see that in the numerical expression column, the constant difference 2 and the first term 3 appear in every term. The changing quantity (variable) is the figure number – 1. Using the pattern, it is easy to see that the 50th term is 2(50-1) + 3= 101 and the 100th term is 2(100-1) + 3 = 201. In general, Figure n will have 2(n-1) + 3 = 2n + 1 squares.


Table 3 – Generalized expression describing the number of squares.

Let us denote the nth term of a sequence by tn. Since 2 and 3 are constants, if we let a be the first term of the sequence and d be the constant difference, then the formula that will describe the nth term of the sequence is

tn = a(n-1) + d

Arithmetic Sequence as a Linear Function

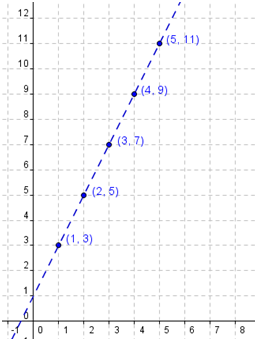
Figure 2 shows the graph of the arithmetic sequence and its trend line denoted by the dashed line. Since we have a constant difference, we have a linear function. If we want to get the equation of the linear function that describes the relationship in our problem, since several ordered pairs are given, we can use the slope intercept formula.

Figure 2 – Graph of the d(n) = 2n + 1, where d(n) is the diagram number

If we extend the trend line, it will pass the (0,1) (Why?). Getting (1,3) as our second point, the slope m will be (3-1)/(1-0) = 2. Hence, the equation of our line will be y = 2x + 1 which is of the same form as tn = 2n + 1 in Table 3.

Slope Concept 2 – Slope of the Graph of a Linear Function

Note: This is the second part  of the the Slope Concept Series. The second and third articles are Part I – Understanding the Basic Concepts of Slope and Part III – Slopes of Vertical and Horizontal Lines.

***

In the Understanding the Basic Concepts of Slope post, we have discussed that slope is described as rise over run. In this post, we are going to show that the slope of a straight line is constant.

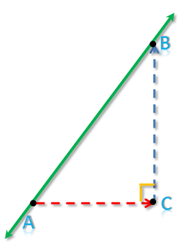
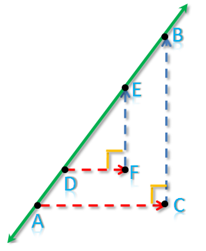
To get the slope of a straight line or a segment, we determine two points on the line, say A and B, draw a horizontal line through point A and a vertical segment through point B. We then determine the intersection of the two line segments and name it C as shown in Figure 1. Angle C is a right angle since BC is a vertical segment and AC is a horizontal segment.

Figure 1 - A line containing points A and B.

The slope of the line containing AB is \frac{BC}{AC}. If we determine two more points, say D and E on the line, and do the process mentioned above, we can come up with triangle DEF right angled at F as shown in Figure 2. In terms of DEF, the slope of the line containing points D and E is \frac{EF}{DF}. Since the line containing DE and AB is practically the same line, we have learned from high school mathematics that their slopes must be equal.  Hence, the following relationship holds: \frac{BC}{AC} = \frac{EF}{DF}.

Why is this so?

Figure 2 - Triangle ABC and DEF with their hypotenuse contained on the line.

To show that the slope of the line is constant, we must show that \frac{BC}{AC} =\frac{EF}{DF}.

Proof That the Slope of a Straight Line is Constant

From Figure 2, BC is parallel to EF, since they are both vertical segments.  Similarly, DF is parallel to AC, since they are both horizontal segments. By the Parallel Postulate, we can consider AB as a transversal of the two pairs of parallel segments.

We can see that angles DEF and ABC are congruent since they are corresponding angles. Angles C and F are also congruent since they are both right angles. Hence, by AA similarity, ABC is similar to DEF.  Since the ratio of the corresponding sides of a similar triangles are equal, it follows that \frac{BC}{AC} =\frac{EF}{DF}.

From the above proof, we have shown that the slope of a straight line, or the slope of the graph of a linear function,  is constant.

1 25 26 27 28 29 31