Tessellation: The Mathematics of Tiling

You have probably noticed that floors are usually tiled in squares or sometimes in rectangles.  What is so special about these shapes? What are the disadvantages of using other shapes?

The most important thing to consider in tiling is that the shape of the tiles should cover the floor without gaps and without overlaps. Probably, this condition will be satisfied easily if the tiles that are used have the same shape and the same size.

If we are going to use regular polygons in tiling, then we can use squares, equilateral triangles or regular hexagons as shown in Figure 2. These polygons will cover the floor without gaps and overlaps, and thus will minimize the need for cutting.

Figure 1 – A honeycomb is an example of hexagonal tiling.*

In mathematics, the term used for tiling a plane (floor in our context) with no gaps and no overlaps is tessellation. Of course, we are not the only one who realized the advantages of shapes that can tessellate. The bees create honeycombs in hexagonal tessellation as shown in Figure 1.
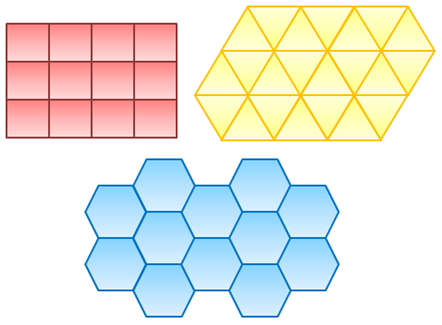
Figure 2 – Examples of regular polygons that can tile the floor without gaps and overlaps.

Note: If you are wondering how these beautiful diagrams were created, I have created a tutorial about it here.

Looking at Figure 3, we can see that not all regular polygons exhibit the property shown by polygons in Figure 2. It is clear that the regular polygons namely pentagons, heptagons and octagons do not tessellate the plane.
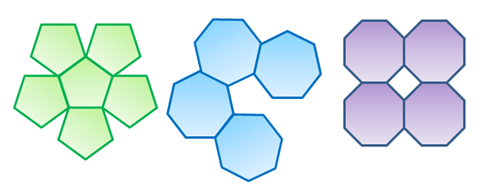
Figure 3 – Examples of polygons that cannot tessellate the plane.

From the discussion above, we want to ask the following questions:

  1. What are the properties of polygons that can tessellate the plane?
  2. Aside from equilateral triangles, squares and regular hexagons, what other polygons can tessellate the plane?


Delving Deeper

In Figure 4, notice that in order for a regular polygon to tessellate the plane, the sum of the interior angles that meet at a common point must equal 360 degrees.
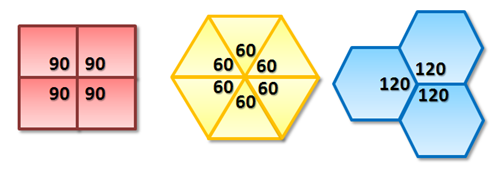
Figure 4 – The Interior angles of polygons that can tessellate the plane add up to 360 degrees.

On the other hand, the three polygons in Figure 5 do not tessellate the plane. In the leftmost illustration, the measure of the interior angles of a regular pentagon is 108 degrees.  If we try to tile the plane, we can see that the measure of the three angles meeting at a common point add up to 324 degrees.  Now, this leaves an “exterior angle” of 36 degrees angle as shown. In the remaining part of this article, we will refer to this type of angle (denoted by red text measurements) as exterior angles.

As we increase the number of sides of a regular polygon, we also observe that we cannot make three interior angles meet at a common point without overlapping. This is shown in the center and rightmost illustration in Figure 5. Only two polygons can have their vertices attached at a common point without overlapping.
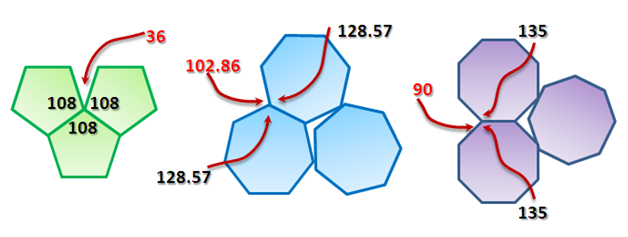
Figure 5 – Exterior angles produced by some polygons.

In the Angle sum of Polygon post, we have discussed that the sum of the interior angles of a polygon with n sides is described by the formula 180(n-2).  Since we have n congruent angles, it follows that each angle measures  \displaystyle\frac{180(n-2)}{n}. As a consequence, as the value of n increases, the measure of the interior angles increases. In effect, the measure of the exterior angle decreases as the value of n increases.

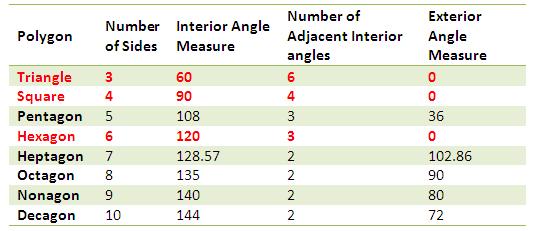
Figure 6 – Table showing properties of tessellating and non-tessellating polygons.

Looking at the table in Figure 6, we can see that polygons whose product of interior angles and the number of adjacent vertices is 360 tessellate. Consequently, the measure of their exterior angles is 0.

Furthermore, observe that as the number of sides of the polygons increases, the fewer the number of vertices that we can fix at a common point without the polygons overlapping.  Since all regular polygons with more than six sides have interior angles measuring greater than 120 degrees, placing their three interior angles at a common point will make two of them overlap.  This is because their angle sum would be greater than 360 degrees (we can verify this using the Tessellation GeoGebra applet).Thus, for polygons more than six sides, only two vertices can be placed adjacently without overlapping. Now, to tessellate, the two adjacent interior angles of these polygons must add up to 360 degrees, which means that each of them must equal 180 degrees. Of course, there is no such polygon. Hence, there is no way that we can tessellate the plane with regular polygons having number of sides greater than six. This proves that the only regular polygons that we can use to tessellate the plane are the three polygons shown in Figure 2.

Non-Regular Tessellations

We will not limit, of course, our creativity by using only regular polygons in tiling floors. The polygons shown in Figure 7 are some of the tiles which are not regular polygons. In the rightmost figure, we used octagons and squares in tiling, which is considered as a semi-regular tessellation.

Figure 7 – Example of non-regular polygon tessellation.

Going Beyond

Not all tessellations are created in the Euclidean plane.  In the leftmost illustration in Figure 8, the sphere is tessellated by a truncated icosidodecahedron.

Figure 8 – Tiling in the Spherical, Hyperbolic and Euclidean Plane**.

The center illustration is an example of tessellation of the hyperbolic plane, created by M.C. Escher and the rightmost illustration is another example of the tessellation of the Euclidean plane – a lso by M.C. Escher.

**********************************************************************

Photos used in this article:

*Buckfast Bee ”Source:”’ picture taken by Frank Mikley on 2006-07-23.  Adapted from the Wikimedia Commons file “Image:Buckfast_bee.jpg” http://upload.wikimedia.org/wikipedia/commons/1/1e/Buckfast_bee.jpg

**1. Spherical truncated Icosidodecahedron .Adapted from the Wikimedia Commons file “Image: Uniform_tiling_532-t012.png”

http://upload.wikimedia.org/wikipedia/en/5/55/Uniform_tiling_532-t012.png

**2. Circle Limit III by M. C. Escher (1959).

**3. Angles and Devils by M. C. Escher (1941).

CaR Tutorial 2 – The MidSegment Theorem

In the previous CaR tutorial, we constructed and isosceles triangle. In this tutorial we are going to explore the properties of the segment connecting the midpoints of its two sides. In this tutorial we are going to learn the following:

  • use the move tool, triangle tool and segment tool
  • find the midpoint of two a segment
  • measure angles using the angle tool
  • edit properties and reveal measures of angles and segments

Construction Steps

1.) Open CaR. We will not need the Coordinate axes so click the Show grid icon until the Show the Grid icon until the grid or axes is not shown.
2.) Click the Triangle tool and click three different points on the drawing pad.
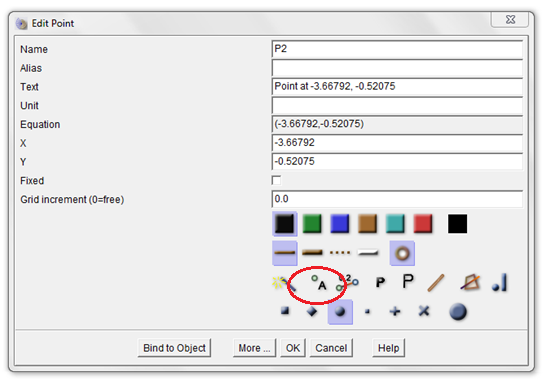
3.) Click the Move tool and right click one of the points to display the Edit Point dialog box. In the Name text box, change the name to A, then click the Show object names button (enclosed with red ellipse in Figure 1).

Figure 1 – The Edit Point dialog box.

4.) Change the name of the other two points to B and C.
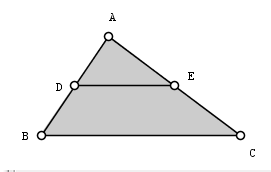
5.) Click the midpoint tool, click point A and click point B to get the midpoint of AB. Now, get the midpoint of BC. Rename the midpoint of AB to E and the midpoint of AC to F (Refer to step 3). Your drawing should look like Figure 2.

Figure 2 – Triangle ABC with midpoints D and E.

6.) Right click and drag the labels to adjust their positions. Using the Move tool, move the vertices of the triangle. What do you observe?
7.) We will see the relationship of the angles and the segments in triangle ABC. We will measure the angle first. To measure angle ADE, click the points in the following order: point A, point B and point C. After this step, you will see the angle symbol at angle ADE.
8.) To display the measure of the angle, click the Move tool and right click the angle symbol. This will display the Edit Angle dialog box shown in Figure 2.
9.) To display the measure of the angle, click the Show object values icon. Then click the smallest angle symbol size to reduce the angle size. Now, click the OK button to apply changes.

Figure 3 – The Edit Angle dialog box.

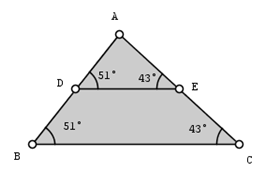
10.)  Using step 8-9, measure angles ABC, ACB and AED. After measuring, your drawing should look like the figure below.

11.)  Using the Move tool, drag the vertices of the triangle. What do you observe?
12.)  Based on the measures of the angles shown in your drawing, what can you say about segment DE and segment BC?
13. ) Now, we will see if there is a relationship between the length of the segments in triangle ABC. To reveal the measure of DE, use the Move tool and right click the segment. This will reveal the Edit Line, Ray, Segment dialog box as shown in Figure 3.

Figure 5 - The Edit Line, Ray, Segment dialog box.

14.)  In the Edit Line, Ray, Segment dialog box, click the Show object values button.
15.)  Using steps 13-14, display the length of segment BC.
16.)  What can you observe about the relationship of segments DE and BC?
17.)  Move the vertices of the triangle. Are your observations still the same?
18.)  Make a conjecture about your observations above.

Derivative and the Maximum Area Problem

Note: This is the third part of the Derivative Concept Series. The first part is The Algebraic and Geometric Meaning of Derivative and the second part is Derivative in Real Life Context.

Introduction

The computation of derivative is often seen in maximum and minimum problems.  In this article, we will discuss why do we get the derivative of a function and equate it to 0 when we want to get its maximum or minimum. To give you a concrete example, let us consider the problem below.

Find the maximum area a rectangle with perimeter 10 units.

Without using calculus, we can substitute values for the rectangle’s length, compute for its width and its corresponding area. If we set the interval to 0.5, then we can come up with the table shown in Figure 1.

Figure 1 - Table showing the length, width, and area of a rectangle with perimeter 10.

Looking at the table above, we can observe that a rectangle of length of 2.5, a square, has the maximum area. If we have prior calculus  knowledge, however, we know that whatever the value of our perimeter, a square having the given perimeter will always have the maximum area.

Using elementary algebra, if we let x be the width of our rectangle, it follows that the length is 5-x. Let f(x) be the area of the rectangle. In effect, the area of the rectangle is described by the equation f(x) = 5x - x^2. We want to maximize the area, which implies that we want to find the maximum value of f(x).

Figure 2 – A rectangle with Perimeter 10 and width x units.

In elementary calculus, to compute for the maximum value of f(x), we get its derivative, which is equal to 5 - 2x, which we will denote f'(x). We then equate the f'(x) to 0 resulting to the equation 5-2x=0 \Rightarrow x = 2.5 which is exactly the maximum value in the table above.

Derivative and Equation to 0

In the article the Algebraic and Geometric Meaning of Derivative, we have learned that the derivative of a function is the slope of the line tangent to that function at a particular point. From elementary algebra, we also have learned the properties of slopes. If a line is rising to the right, the slope is greater than 0; if the line is rising to the to the left, then the slope is less than 0. We have also learned that a horizontal line has slope 0 and the vertical line has an undefined slope.

Figure 3 – Properties of slope of a straight line.

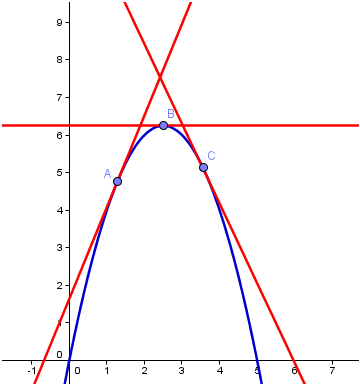
In the problem above, we calculated by getting the derivative (the slope of the line tangent to a function at a particular point) and equate it to 0. But a line with slope 0 is a horizontal line. In effect, we are looking for a horizontal tangent of f(x) = 5x-x^2. To give a clearer picture let us look at the graph of f(x) = 5x - x^2.

Figure 4 – Tangent lines of 5x – x2.

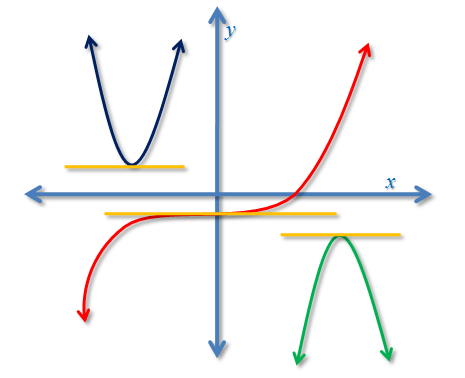
From the graph it is clear that the maximum point of the function is where the tangent line (red line) horizontal. In fact, there are only three possible cases that tangent line could be horizontal as shown in Figure 5: first, the minimum of a function (blue graph); second, the inflection point (red graph); and the third is the maximum of the function (green graph).

It should also be noteworthy to say that all the ordered pairs (length, area) or(width, area) in Figure 1 will be on the blue curve in Figure 4.

Figure 5 – Cases of a graph where the tangent is horizontal.

The derivative has many applications and it is seen in many topics in calculus.  In the next Derivative Tutorial, we are going to discuss how the derivative is used in other context.

Summary

  • The derivative of a function is the slope of the line tangent to a function at a particular point.
  • The horizontal line has slope zero.
  • In solving maxima and minima problems, we get the derivative of a function and equate to zero to get the minimum or maximum. We do this because geometrically, we want to get the line tangent to a function at a particular point that is horizontal.
1 146 147 148 149 150 157